Assumption: Fire Incidents, Illinois (IL)
Where are fire incidents reported in Assumption, IL
Something went wrong! Please refresh the page.
|
| |||||||||||||||||||||||||||||||||||||||||||||||||||||||||||||||||||||||||||||||||||||||||||||||||||||||||||||
| Other | 23 | |||||||||||||||||||||||||||||||||||||||||||||||||||||||||||||||||||||||||||||||||||||||||||||||||||||||||||||
2005 - 2018 National Fire Incident Reporting System (NFIRS) incidents
- Incident types reported to NFIRS in Assumption, IL
- 16753.5%Fire
- 4815.4%Hazardous Condition
- 4313.8%Rescue & EMS
- 3912.5%False Alarm
- 92.9%Good Intent Call
- 51.6%Service Call
- 10.3%Severe Weather
- Fire incident types reported to NFIRS in Assumption, IL
- 9456.3%Structure Fires
- 5432.3%Outside Fires
- 1810.8%Mobile Property/Vehicle Fires
- 10.6%Other
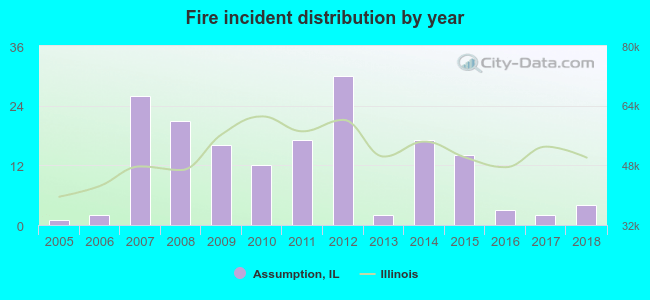 Based on the data from the years 2005 - 2018 the average number of fires per year is 12. The highest number of fire incidents - 30 took place in 2012, and the least - 1 in 2005. The data has a rising trend.
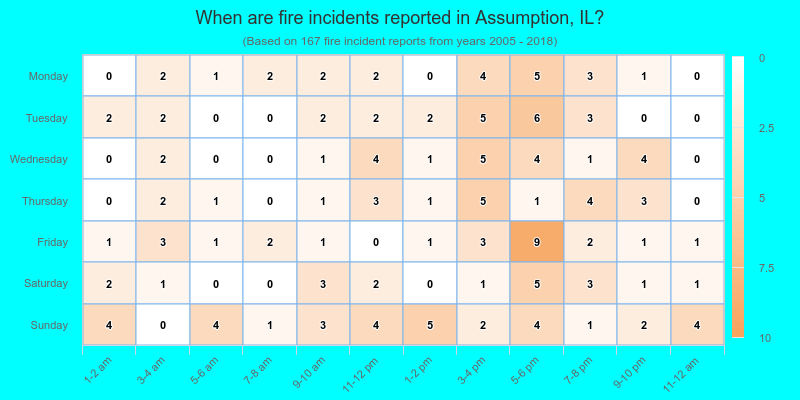
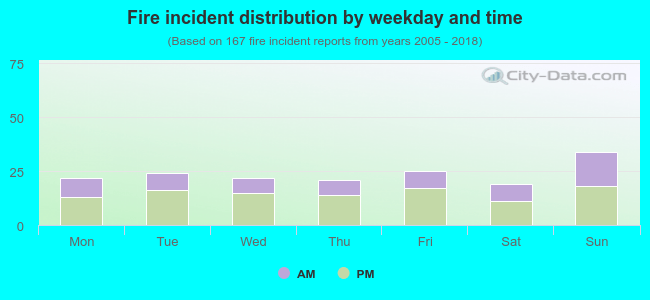 37.7% incidents where reported in the morning and 62.3% in the evening. The most fires (20.4%) took place on Sunday, and the least (11.4%) on Saturday.
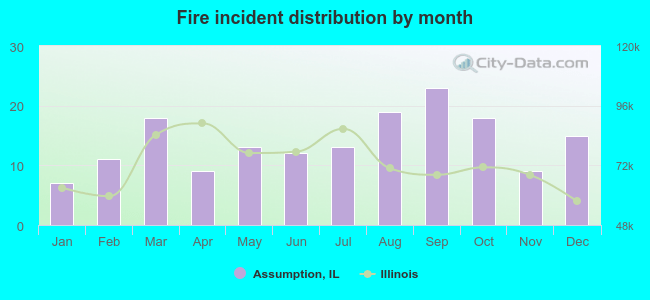 According to the 167 fire incident reports from years 2005 - 2018 most fires (13.8%) took place during September, and the least (4.2%) in January.
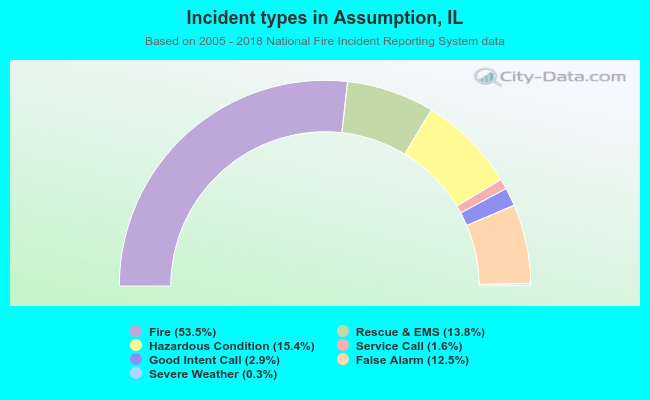 Out of all 312 cases reported during the years 2005 - 2018, the most belonged to the categories: Fire (53.5%), Rescue & EMS (15.4%), and Overpressure Rupture (13.8%).
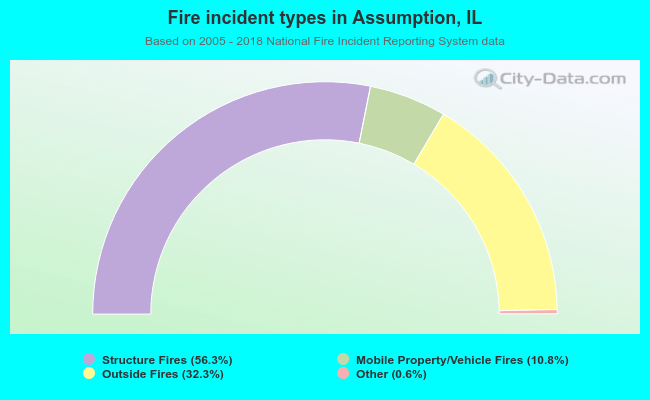 When looking into fire subcategories, the most reports belonged to: Structure Fires (56.3%), and Outside Fires (32.3%).