Bacliff: Fire Incidents, Texas (TX)
Where are fire incidents reported in Bacliff, TX
Something went wrong! Please refresh the page.
|
| |||||||||||||||||||||||||||||||||||||||||||||||||||||||||||||||||||||||||||||||||||||||||||||||||||||||||||||
2003 - 2018 National Fire Incident Reporting System (NFIRS) incidents
- Incident types reported to NFIRS in Bacliff, TX
- 67638.8%Rescue & EMS
- 37321.4%Fire
- 30317.4%Hazardous Condition
- 28816.5%Good Intent Call
- 734.2%Service Call
- 251.4%False Alarm
- 30.2%Special Incident
- Fire incident types reported to NFIRS in Bacliff, TX
- 15441.3%Structure Fires
- 14238.1%Outside Fires
- 4512.1%Other
- 328.6%Mobile Property/Vehicle Fires
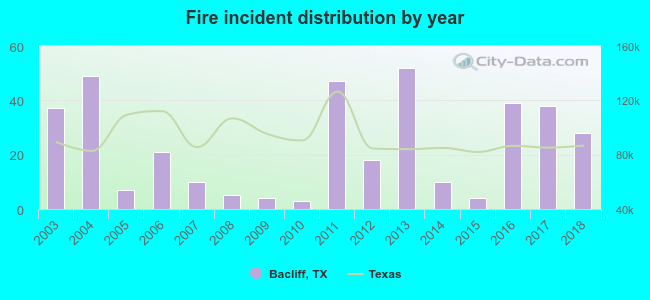 Based on the data from the years 2003 - 2018 the average number of fires per year is 23. The highest number of fire incidents - 52 took place in 2013, and the least - 3 in 2010. The data has a dropping trend.
The average number of yearly fire incidents per 10k residents in Bacliff, TX compared to nearest cities:
(Note: Based on data for the last 3 years, including only cities with population 5,000 and above)
| Bacliff: | 40.6 |
| Seabrook: | 13.6 |
| Dickinson: | 40.8 |
| League City: | 15.7 |
| Texas City: | 44.2 |
| Webster: | 63.6 |
| La Marque: | 41.9 |
| Santa Fe: | 71.3 |
| La Porte: | 26.5 |
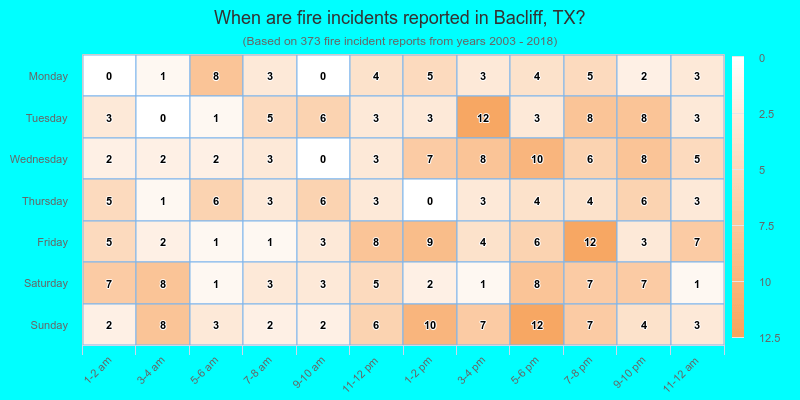
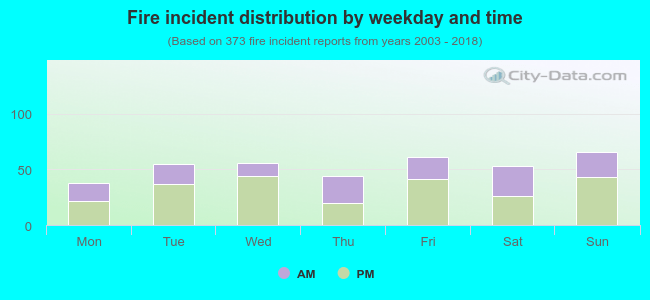 37.5% incidents where reported in the morning and 62.5% in the evening. The most fires (17.7%) took place on Sunday, and the least (10.2%) on Monday.
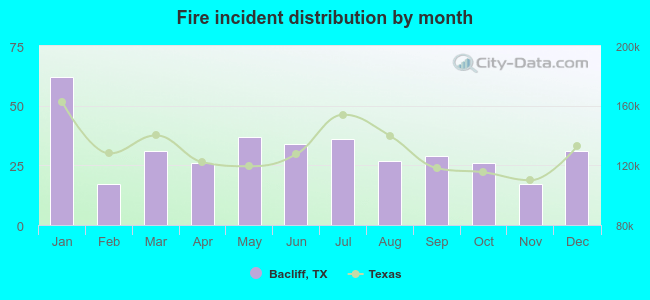 Based on the 373 reports from years 2003 - 2018 most fires (16.6%) took place during January, and the least (4.6%) in February.
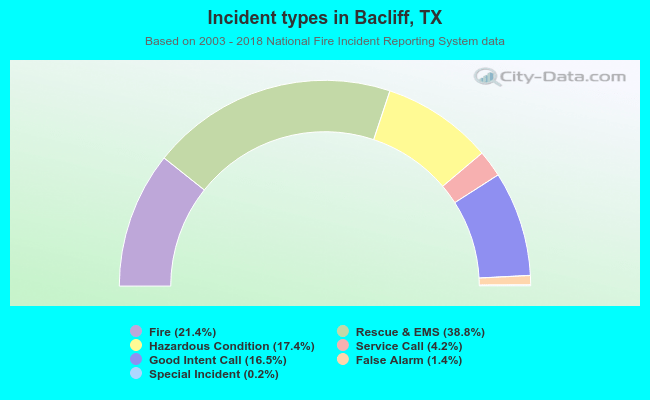 Out of all 1,741 cases reported during the years 2003 - 2018, the most belonged to the categories: Overpressure Rupture (38.8%), Fire (21.4%), and Rescue & EMS (17.4%).
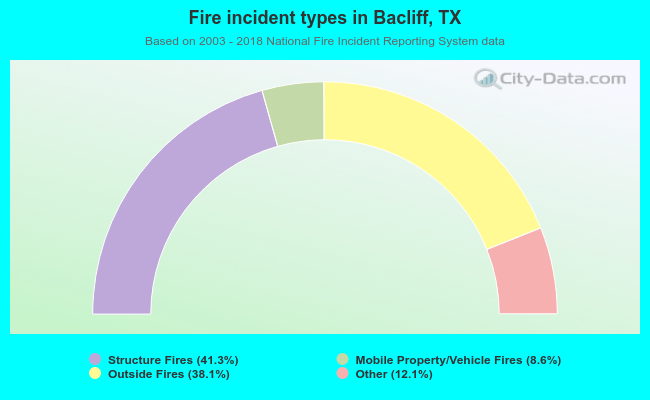 When looking into fire subcategories, the most incidents belonged to: Structure Fires (41.3%), and Outside Fires (38.1%).