| Fire incidents reported |
|---|
| Sreet name | Count |
|---|
| NB I15 | 38 | | I15 | 16 | | SB I15 | 16 | | HWY 36 | 14 | | BAKER BLVD | 12 | | NB 15 BAKERGT HALLORAN SPGS | 10 | | SB I-15 | 8 | | 15 | 6 | | 36 HWY | 6 | | I15 FWY | 6 | | NB 15 HALLORAN SPGS | 6 | | NB 15 HALLORAN SPGSGT HALLO SMT | 6 | | NORTH 15 | 6 | | HWY 127 | 4 | | I 15 | 4 | | INTERSTATE 15 | 4 | | MM150 NB I15 | 4 | | NB 15 BAKER HALLORAN SPRINGS | 4 | | SB 15 HALLORAN SPRINGSGT BA | 4 | | SB I15 FWY | 4 | | AFTON CANYON RD DUNN RD | 2 | | AFTON CANYON RD I 15 EXIT 22 | 2 | | BAKER BL | 2 | | BAKER BLVD I 15 EXIT 248 OFR | 2 | | BAKER BLVD I 15 EXIT 248 OFR BLVD | 2 |
| | | Fire incidents reported |
|---|
| Sreet name | Count |
|---|
| BAKER BLVD STATE HWY 127 | 2 | | BALL RD | 2 | | BALL RD | 2 | | BASIN RD | 2 | | BOWMAN RD | 2 | | CALICO CIR | 2 | | CALICO LN | 2 | | CANNON RD. HLS | 2 | | DUMONT DUNES RD | 2 | | DUNN RD | 2 | | HALLORAN SPRINGS RD | 2 | | HIGHWAY 36 | 2 | | HIGHWAY 36 HWY | 2 | | HIGHWAY127 | 2 | | HWY 36 W HWY | 2 | | HWY 36 WEST HWY | 2 | | HWY 36W HWY | 2 | | I - 15 FWY | 2 | | I 15 EXIT 233 OFRP N RASOR RD | 2 | | I 15 EXIT 259 OFRP S HALLORA RD | 2 | | I 15 FWY | 2 | | I15 NORTH BOUND | 2 | | MM113 NB I15 | 2 | | MM114 SB I15 | 2 | | MM116 | 2 |
|
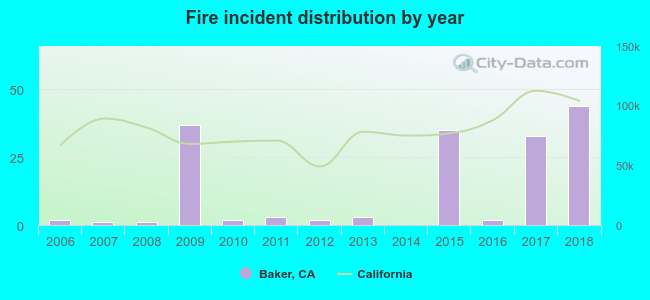 According to the data from the years 2006 - 2018 the average number of fires per year is 13. The highest number of reported fire incidents - 44 took place in 2018, and the least - 0 in 2014. The data has a rising trend.
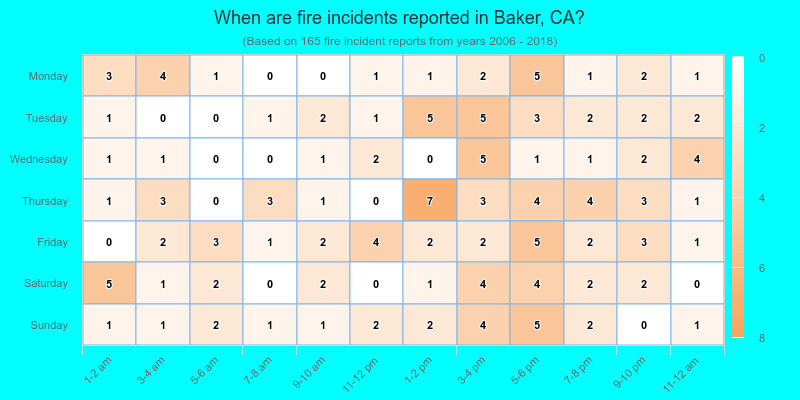
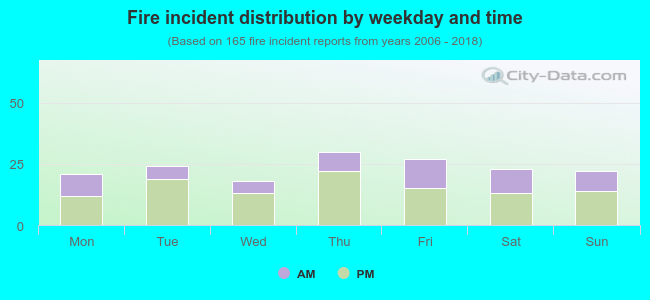 34.5% incidents where reported in the morning and 65.5% in the evening. The most fires (18.2%) took place on Thursday, and the least (10.9%) on Wednesday.
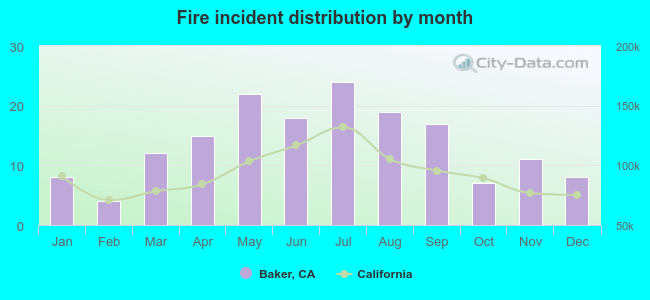 Based on the 165 fire incidents from years 2006 - 2018 most fires (14.5%) took place during July, and the least (2.4%) in February.
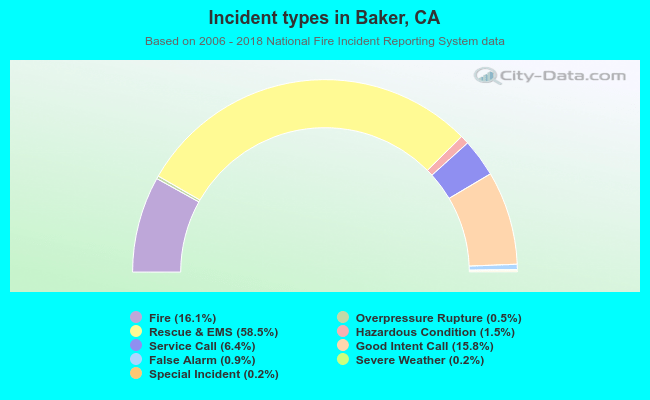 Out of all 1,022 cases reported during the years 2006 - 2018, the most belonged to the categories: Rescue & EMS (58.5%), Fire (16.1%), and Good Intent Call (15.8%).
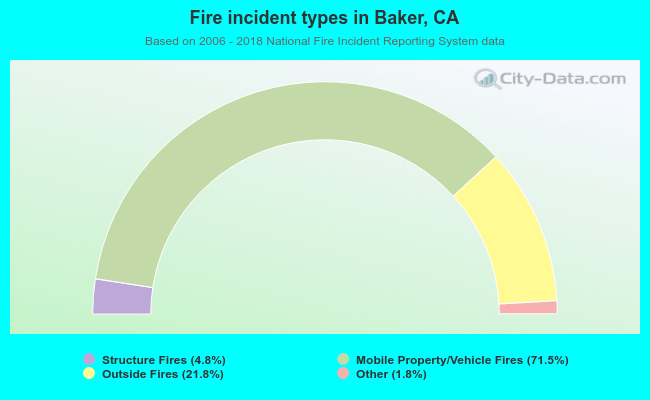 When looking into fire subcategories, the most reports belonged to: Mobile Property/Vehicle Fires (71.5%), and Outside Fires (21.8%).