| Fire incidents reported |
|---|
| Sreet name | Count |
|---|
| US ROUTE 302 | 36 | | RT 302 | 22 | | ROUTE 302 | 18 | | ROLLING RIDGE ROAD | 14 | | RIVER RUN ROAD | 10 | | ROUTE 302 HWY | 10 | | ALBANY AVENUE | 8 | | BEAR NOTCH ROAD | 6 | | COW HILL ROAD | 6 | | FOSTER STREET | 6 | | RT 16 | 6 | | ALBANY AVE | 4 | | AMMONOOSUC DRIVE | 4 | | CATHEDRAL LEDGE DR | 4 | | FOREST LEDGE RD | 4 | | GARLAND RIDGE ROAD | 4 | | JERICHO RD | 4 | | JERICHO ROAD | 4 | | KEARSARGE STREET | 4 | | MILL ST | 4 | | ROUTE 16A | 4 | | WILES ROAD | 4 | | 271 COBB FARM ROAD | 2 | | 302 HWY | 2 | | ALBANY AVE | 2 |
| | | Fire incidents reported |
|---|
| Sreet name | Count |
|---|
| ALLEN ROAD | 2 | | AMMONOOSUC DR | 2 | | AMONUSSUC DRIVE | 2 | | BEAR NOTCH RD | 2 | | BEARFOOT CREEK RD | 2 | | BEAVER DAM LANE | 2 | | CATHEDRAL LEDGE ROAD | 2 | | CHURCH ST | 2 | | COBB FARM RD | 2 | | COVERED BRIDGE ROAD | 2 | | CRAWFORD HILLS ROAD | 2 | | DANDEE ROAD | 2 | | DUNDEE ROAD | 2 | | EMERY LANE | 2 | | EMERY LN | 2 | | FOREST AVENUE | 2 | | FOSTER ST | 2 | | GARLAND RIDGE RD | 2 | | GLENLEDGE ROAD | 2 | | GRAND SUMMIT DR | 2 | | GRAND SUMMIT RD | 2 | | GRAND SUMMIT ROAD | 2 | | GRAVEL RD | 2 | | GROVE STREET | 2 | | |
|
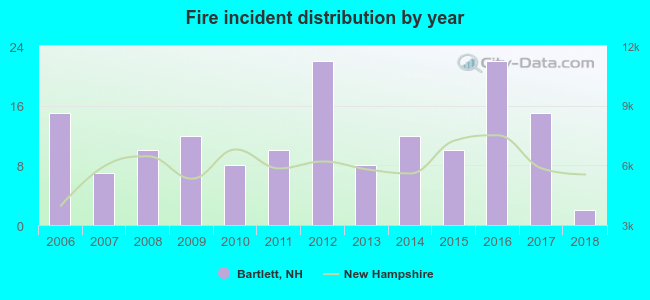 According to the data from the years 2006 - 2018 the average number of fire incidents per year is 12. The highest number of fire incidents - 22 took place in 2012, and the least - 2 in 2018. The data has a declining trend.
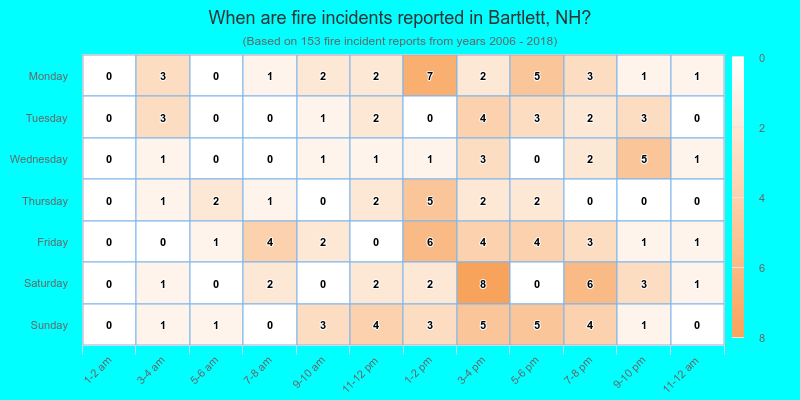
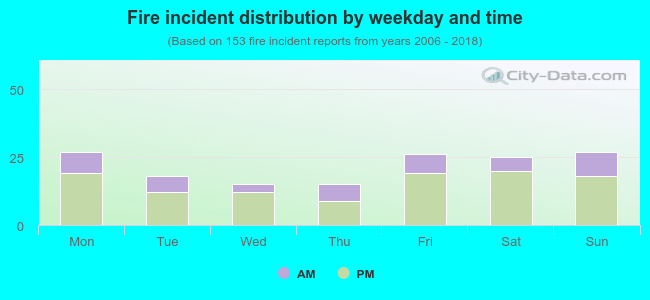 28.8% incidents where reported in the morning and 71.2% in the evening. The most fires (17.6%) took place on Monday, and the least (9.8%) on Wednesday.
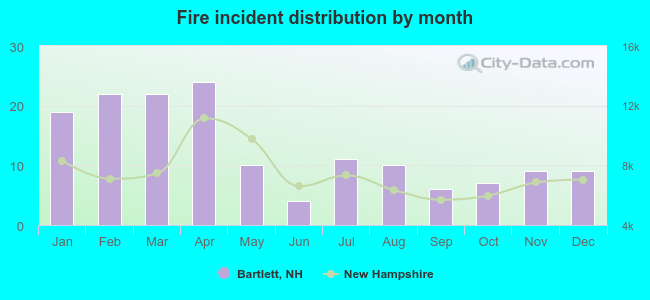 Based on the 153 fire incidents from years 2006 - 2018 most fires (15.7%) took place during April, and the least (2.6%) in June.
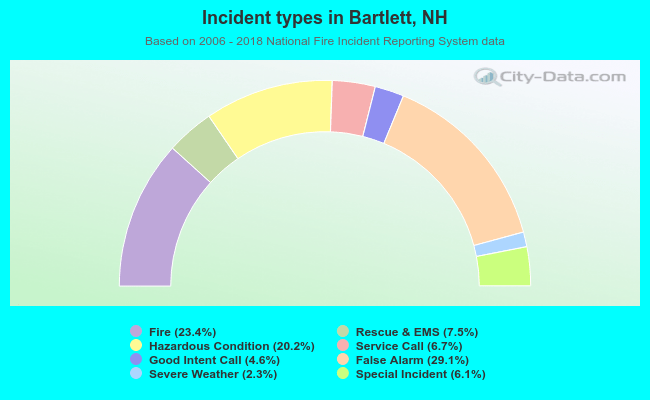 Out of all 653 cases reported during the years 2006 - 2018, the most belonged to the categories: Good Intent Call (29.1%), Fire (23.4%), and Rescue & EMS (20.2%).
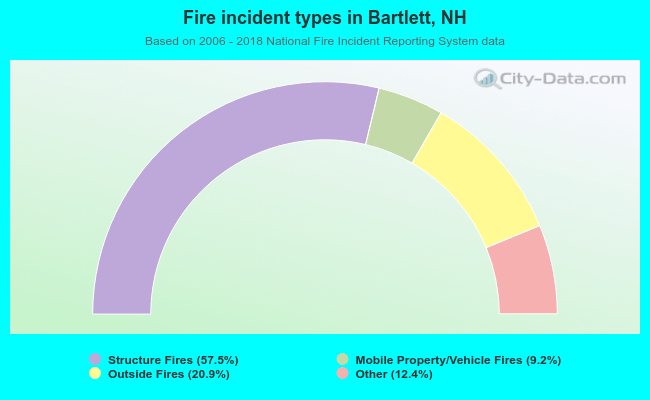 When looking into fire subcategories, the most reports belonged to: Structure Fires (57.5%), and Outside Fires (20.9%).