| Fire incidents reported |
|---|
| Sreet name | Count |
|---|
| HWY 30 | 10 | | ORCHARD BENCH RD | 10 | | HWY 20 HWY | 8 | | 3RD ST | 6 | | 4TH ST | 6 | | 6TH ST | 6 | | GOLF COURSE RD | 4 | | HWY 433 | 4 | | SHERMAN AVE MANDERSON | 4 | | 1005 CLOUD PEAK | 2 | | 105 S 4TH | 2 | | 1366 ANTELOPE DR. | 2 | | 1885 LANE 43 | 2 | | 205 S. 3RD | 2 | | 252 NTH 8TH | 2 | | 2651 LANE 37 | 2 | | 2852 LANE 48 | 2 | | 300 NORTH ST. | 2 | | 301 SOUTH 6TH. | 2 | | 310 CRESENT DRIVE | 2 | | 355 N 4TH | 2 | | 388 S. US. HWY 20 | 2 | | 416 SO.1ST. | 2 | | 4391 RD. 16 | 2 | | 4447 ORCHARD BENCH RD | 2 |
| | | Fire incidents reported |
|---|
| Sreet name | Count |
|---|
| 463 N 5TH | 2 | | 4641 ORCHARD BENCH ROAD | 2 | | 4831 ORCHARD BENCH RD. | 2 | | 507 S. 5TH | 2 | | 5TH | 2 | | 610 WEST F ST. | 2 | | 611 CHEYENNE ST. | 2 | | 611 WEST A ST. | 2 | | 613 HWY 30 | 2 | | 618 WEST E | 2 | | 658 N 8TH | 2 | | 6TH E ST | 2 | | 700 BLOCK OF MYRTYL | 2 | | 7TH ST | 2 | | 8 TH ST | 2 | | 871 HWY 20 SOUTH | 2 | | 8TH ST | 2 | | 91 HWY 31 | 2 | | 910 WEST B | 2 | | 9TH ST | 2 | | A ST | 2 | | ANTELOPE STR | 2 | | BASEBALL FIELDS | 2 | | BASIN BASEBALL FIELDS | 2 | | |
|
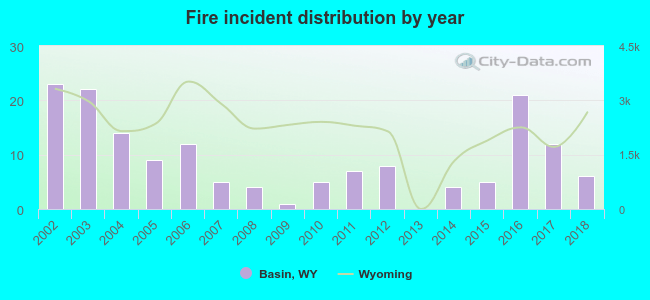 According to the data from the years 2002 - 2018 the average number of fires per year is 9. The highest number of reported fire incidents - 23 took place in 2002, and the least - 0 in 2013. The data has a dropping trend.
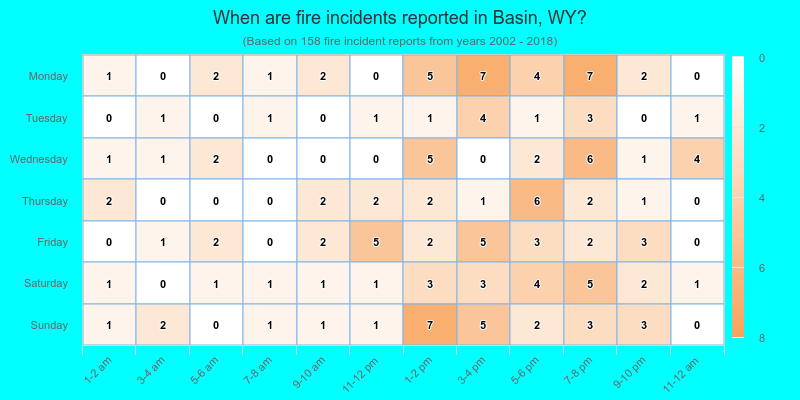
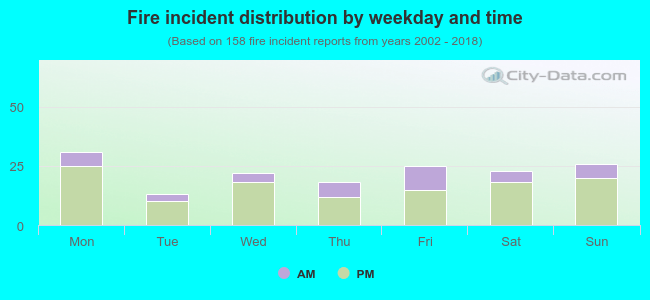 25.3% incidents where reported in the morning and 74.7% in the evening. The most fires (19.6%) took place on Monday, and the least (8.2%) on Tuesday.
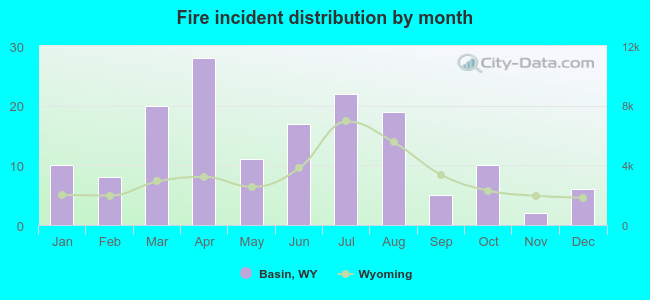 Based on the 158 fire incidents from years 2002 - 2018 most fires (17.7%) took place during April, and the least (1.3%) in November.
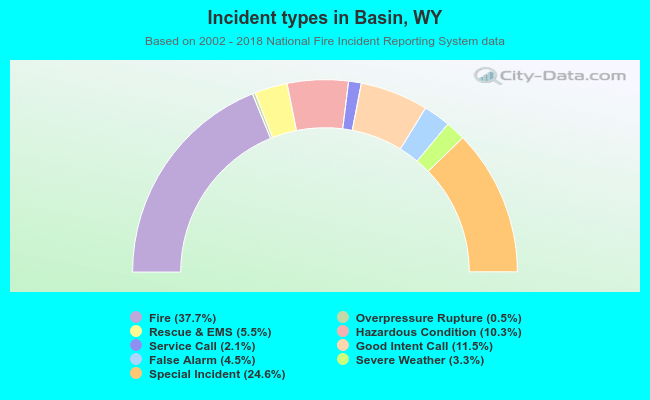 Out of all 419 cases reported during the years 2002 - 2018, the most belonged to the categories: Fire (37.7%), Special Incident (24.6%), and Good Intent Call (11.5%).
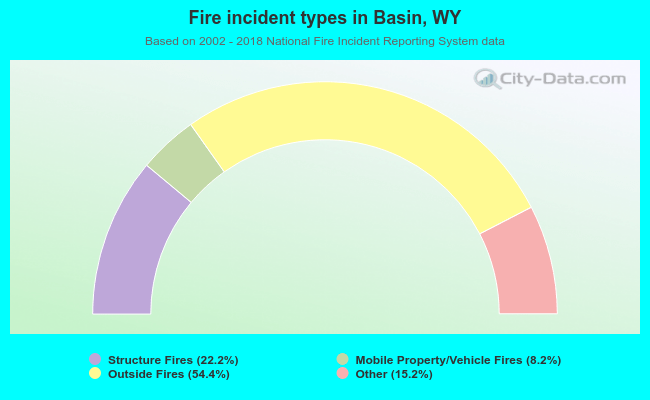 When looking into fire subcategories, the most incidents belonged to: Outside Fires (54.4%), and Structure Fires (22.2%).