Bearden: Fire Incidents, Arkansas (AR)
Where are fire incidents reported in Bearden, AR
Something went wrong! Please refresh the page.
|
| |||||||||||||||||||||||||||||||||||||||||||||||||||||||||||||||||||||||||||||||||||||||||||||||||||||||||||||
| Other | 6 | |||||||||||||||||||||||||||||||||||||||||||||||||||||||||||||||||||||||||||||||||||||||||||||||||||||||||||||
2006 - 2018 National Fire Incident Reporting System (NFIRS) incidents
- Incident types reported to NFIRS in Bearden, AR
- 31682.3%Fire
- 225.7%Rescue & EMS
- 205.2%Hazardous Condition
- 184.7%Good Intent Call
- 51.3%False Alarm
- 30.8%Service Call
- Fire incident types reported to NFIRS in Bearden, AR
- 15850.0%Outside Fires
- 10834.2%Structure Fires
- 4113.0%Mobile Property/Vehicle Fires
- 92.8%Other
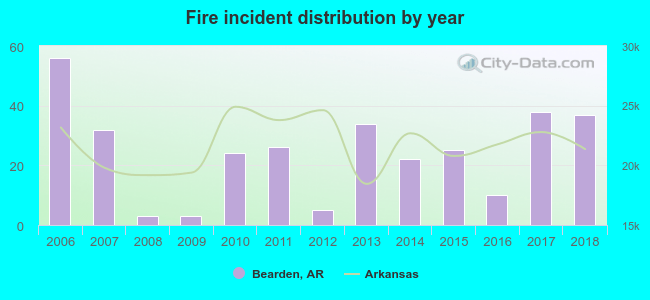 Based on the data from the years 2006 - 2018 the average number of fires per year is 24. The highest number of reported fires - 56 took place in 2006, and the least - 3 in 2008. The data has a decreasing trend.
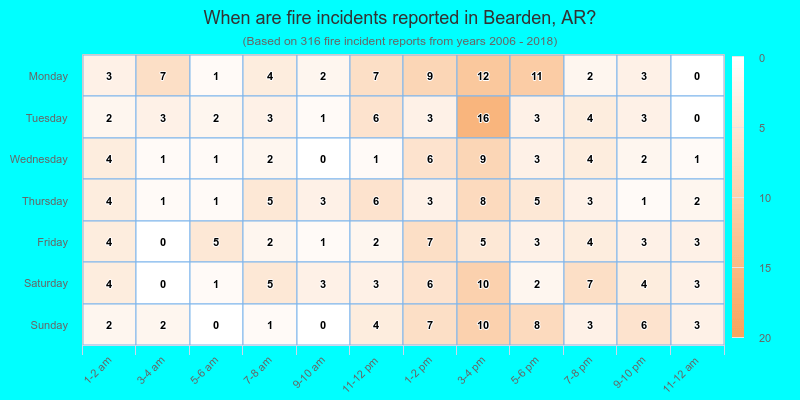
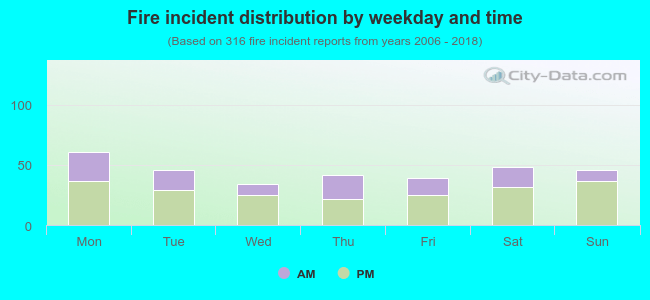 34.5% incidents where reported in the morning and 65.5% in the evening. The most fires (19.3%) took place on Monday, and the least (10.8%) on Wednesday.
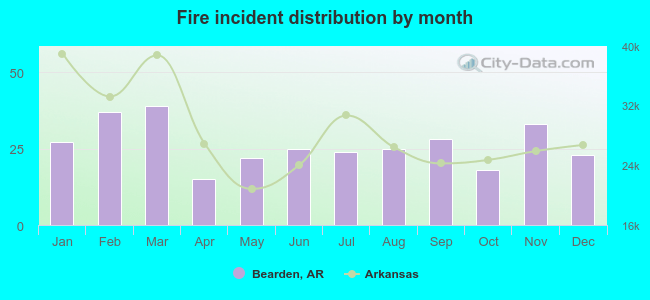 Based on the 316 fire incident reports from years 2006 - 2018 most fires (12.3%) took place during March, and the least (4.7%) in April.
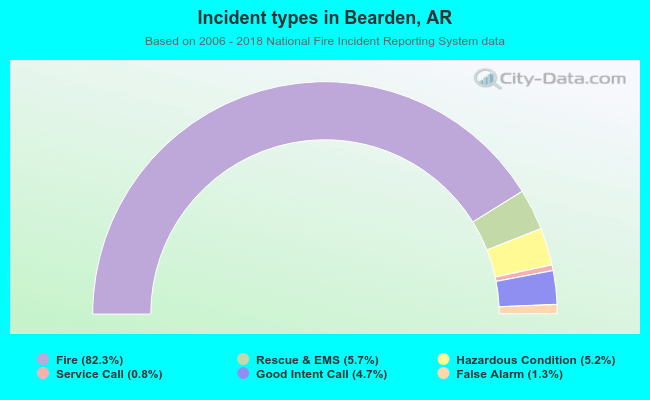 Out of all 384 cases reported during the years 2006 - 2018, the most belonged to the categories: Fire (82.3%), Overpressure Rupture (5.7%), and Rescue & EMS (5.2%).
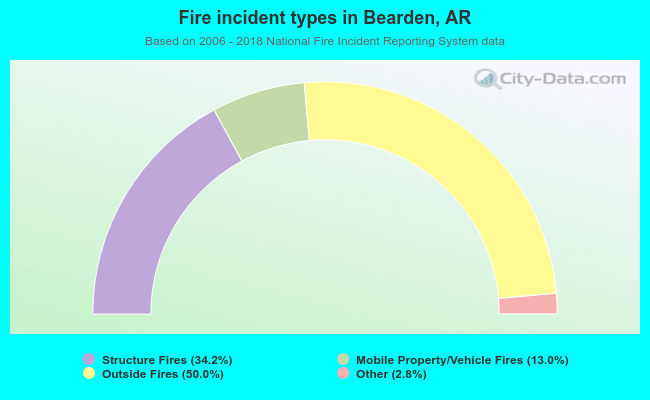 When looking into fire subcategories, the most incidents belonged to: Outside Fires (50.0%), and Structure Fires (34.2%).