Beaumont: Fire Incidents, California (CA)
Where are fire incidents reported in Beaumont, CA
Something went wrong! Please refresh the page.
|
| |||||||||||||||||||||||||||||||||||||||||||||||||||||||||||||||||||||||||||||||||||||||||||||||||||||||||||||
2005 - 2018 National Fire Incident Reporting System (NFIRS) incidents
- Incident types reported to NFIRS in Beaumont, CA
- 60366.3%Rescue & EMS
- 15016.5%Fire
- 586.4%Service Call
- 475.2%False Alarm
- 222.4%Hazardous Condition
- 222.4%Good Intent Call
- 50.5%Special Incident
- 20.2%Severe Weather
- 10.1%Overpressure Rupture
- Fire incident types reported to NFIRS in Beaumont, CA
- 12382.0%Outside Fires
- 1510.0%Structure Fires
- 85.3%Mobile Property/Vehicle Fires
- 42.7%Other
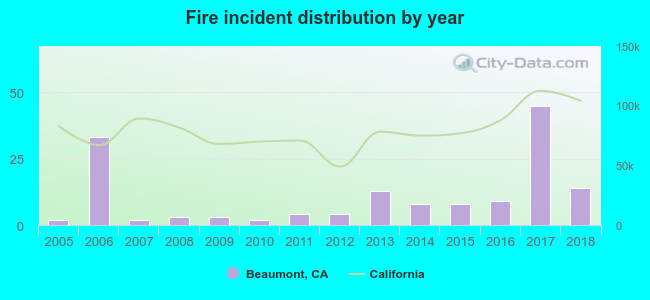 According to the data from the years 2005 - 2018 the average number of fire incidents per year is 11. The highest number of fire incidents - 45 took place in 2017, and the least - 2 in 2005. The data has a rising trend.
The average number of yearly fire incidents per 10k residents in Beaumont, CA compared to nearest cities:
(Note: Based on data for the last 3 years, including only cities with population 5,000 and above)
| Beaumont: | 5.4 |
| Cherry Valley: | 6.3 |
| Banning: | 12.8 |
| Calimesa: | 15.8 |
| Yucaipa: | 2.6 |
| San Jacinto: | 8.0 |
| Nuevo: | 3.9 |
| Hemet: | 33.0 |
| Valle Vista: | 1.4 |
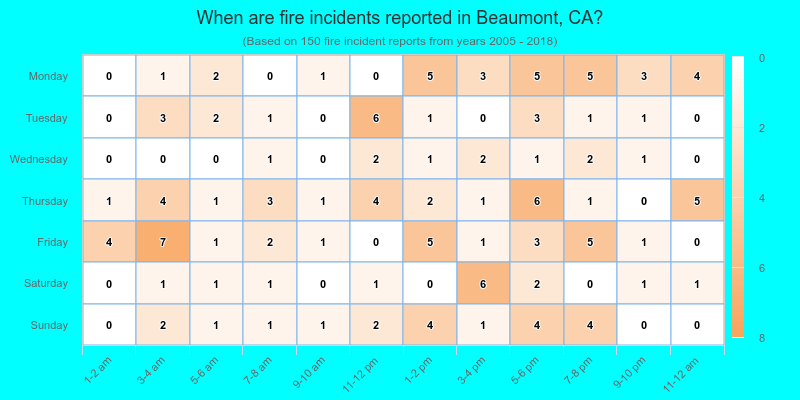
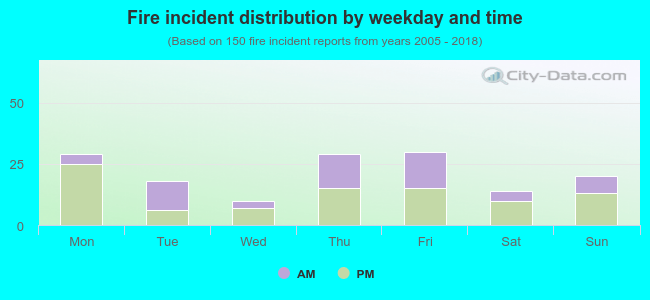 39.3% incidents where reported in the morning and 60.7% in the evening. The most fires (20.0%) took place on Friday, and the least (6.7%) on Wednesday.
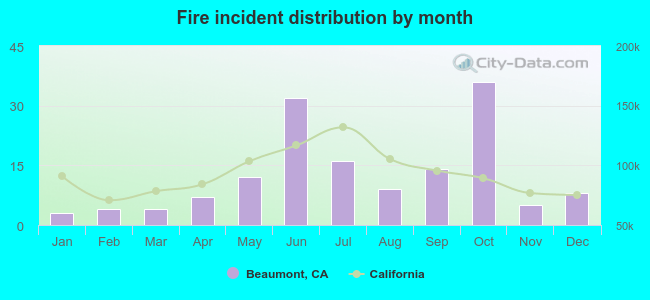 Based on the 150 reports from years 2005 - 2018 most fires (24.0%) took place during October, and the least (2.0%) in January.
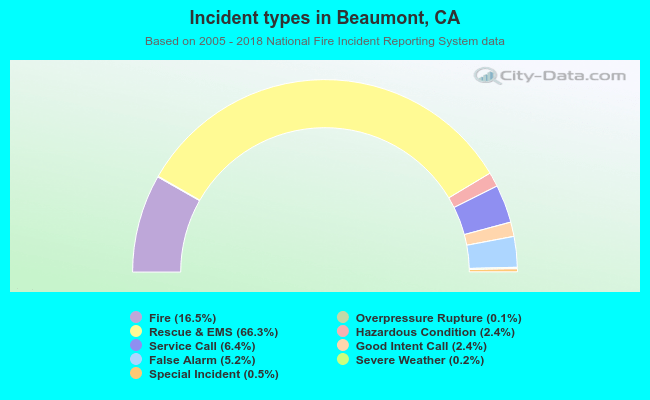 Out of all 910 cases reported during the years 2005 - 2018, the most belonged to the categories: Rescue & EMS (66.3%), Fire (16.5%), and Service Call (6.4%).
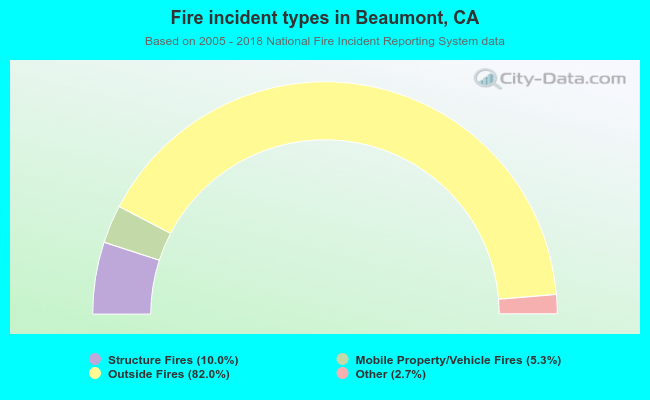 When looking into fire subcategories, the most reports belonged to: Outside Fires (82.0%), and Structure Fires (10.0%).