| Fire incidents reported |
|---|
| Sreet name | Count |
|---|
| HWY 85 | 18 | | 85 HWY | 8 | | I94 | 8 | | 134 AVE | 4 | | 1 MILE N | 2 | | 10 ST SW | 2 | | 105 2 AVE | 2 | | 108 S MAIN ST | 2 | | 11 MI S HWY 85 | 2 | | 121 AVE | 2 | | 124TH AVE SW | 2 | | 12575 45R ST SW | 2 | | 126TH AVE SW | 2 | | 128 AVE | 2 | | 12820 37 ST SW | 2 | | 12820 37TH ST SW | 2 | | 12858 29TH ST SW | 2 | | 128TH AVE | 2 | | 128TH AVE 38TH ST | 2 | | 131 AVE | 2 | | 131 AVE SW | 2 | | 131ST AVENUE SW | 2 | | 133 AVE | 2 | | 133 AVE SW | 2 | | 134 AVE SW | 2 |
| | | Fire incidents reported |
|---|
| Sreet name | Count |
|---|
| 134TH AVE | 2 | | 135 1/2 RURAL AVE SW | 2 | | 136 RURAL AVE | 2 | | 136TH AVE SW | 2 | | 2 ST | 2 | | 20 ST | 2 | | 20TH ST SW | 2 | | 216 2ND ST SW | 2 | | 217 3RD ST SW | 2 | | 22ND ST | 2 | | 26 ST SW | 2 | | 2686 126TH AVE R SW | 2 | | 26TH ST SW | 2 | | 2715 GREEN RIVER RD AVE | 2 | | 30ST | 2 | | 32ND STREET | 2 | | 34TH ST SW | 2 | | 35 RURAL ST | 2 | | 35 ST SW | 2 | | 38 STREET RURAL SW | 2 | | 38TH STREET RURAL SW | 2 | | 3920 131ST AVE RURAL SW | 2 | | 4 MI S OF BELFIELD | 2 | | 4345 HIWAY 85 SW | 2 | | |
|
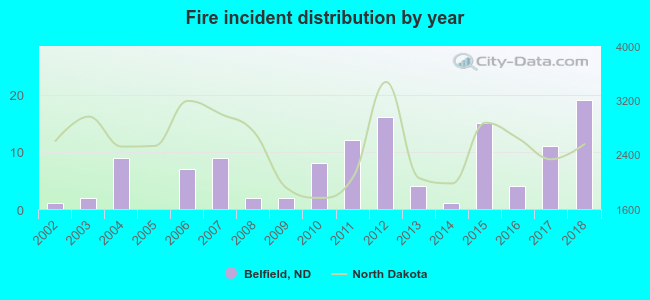 According to the data from the years 2002 - 2018 the average number of fires per year is 7. The highest number of fire incidents - 19 took place in 2018, and the least - 0 in 2005. The data has a rising trend.
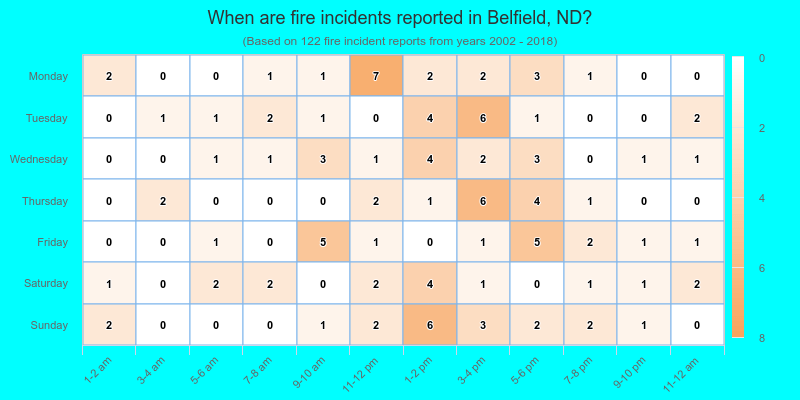
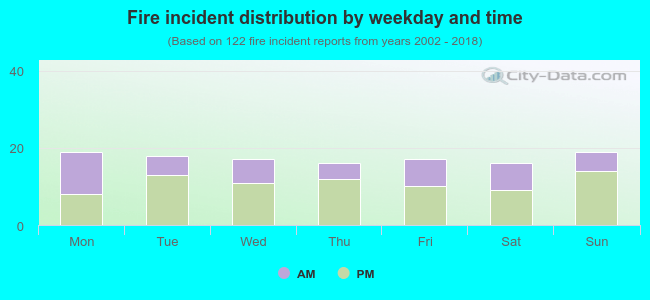 36.9% incidents where reported in the morning and 63.1% in the evening. The most fires (15.6%) took place on Monday, and the least (13.1%) on Thursday.
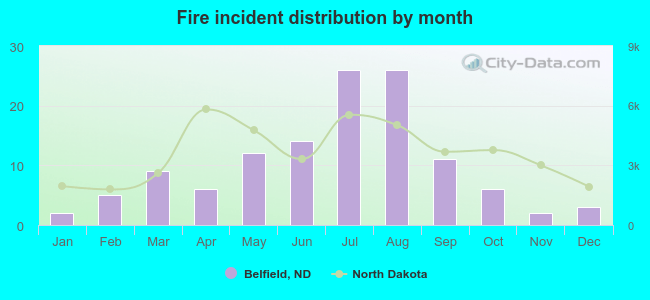 Based on the 122 incident reports from years 2002 - 2018 most fires (21.3%) took place during July, and the least (1.6%) in January.
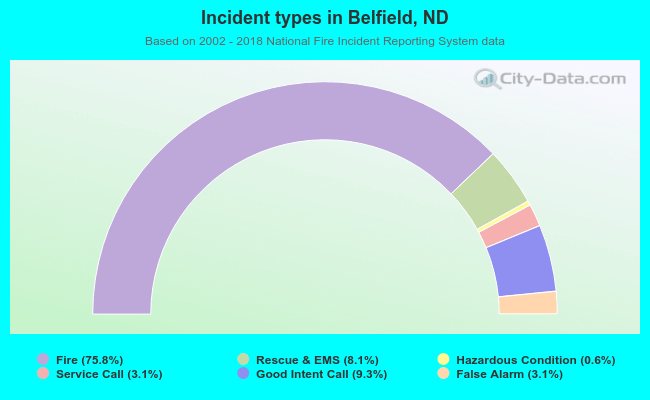 Out of all 161 cases reported during the years 2002 - 2018, the most belonged to the categories: Fire (75.8%), Service Call (9.3%), and Overpressure Rupture (8.1%).
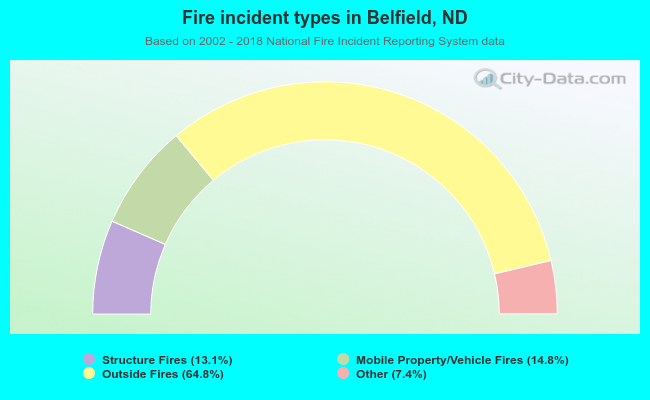 When looking into fire subcategories, the most incidents belonged to: Outside Fires (64.8%), and Mobile Property/Vehicle Fires (14.8%).