Bellevue: Fire Incidents, Michigan (MI)
Where are fire incidents reported in Bellevue, MI
Something went wrong! Please refresh the page.
|
| |||||||||||||||||||||||||||||||||||||||||||||||||||||||||||||||||||||||||||||||||||||||||||||||||||||||||||||
| Other | 8 | |||||||||||||||||||||||||||||||||||||||||||||||||||||||||||||||||||||||||||||||||||||||||||||||||||||||||||||
2002 - 2018 National Fire Incident Reporting System (NFIRS) incidents
- Incident types reported to NFIRS in Bellevue, MI
- 88144.8%Rescue & EMS
- 39920.3%Hazardous Condition
- 37819.2%Fire
- 1578.0%Good Intent Call
- 1276.5%Service Call
- 211.1%False Alarm
- 20.1%Overpressure Rupture
- 20.1%Special Incident
- Fire incident types reported to NFIRS in Bellevue, MI
- 15039.7%Outside Fires
- 14237.6%Structure Fires
- 6416.9%Mobile Property/Vehicle Fires
- 225.8%Other
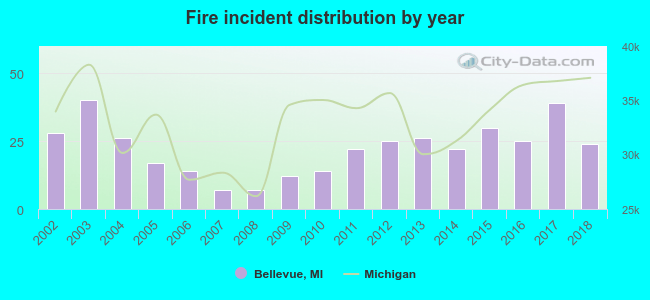 Based on the data from the years 2002 - 2018 the average number of fire incidents per year is 22. The highest number of reported fire incidents - 40 took place in 2003, and the least - 7 in 2007. The data has a decreasing trend.
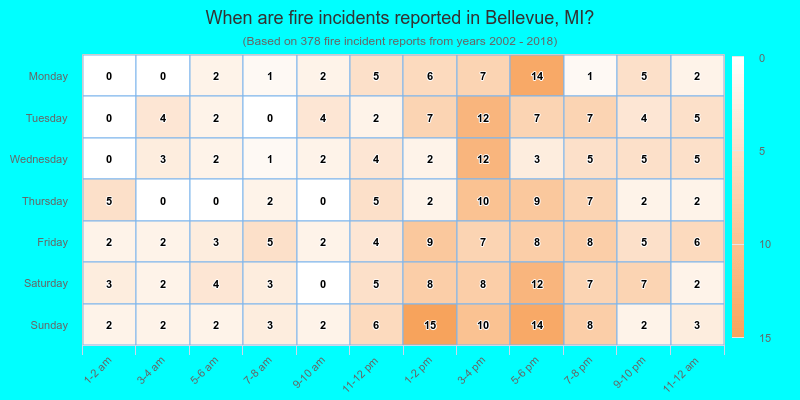
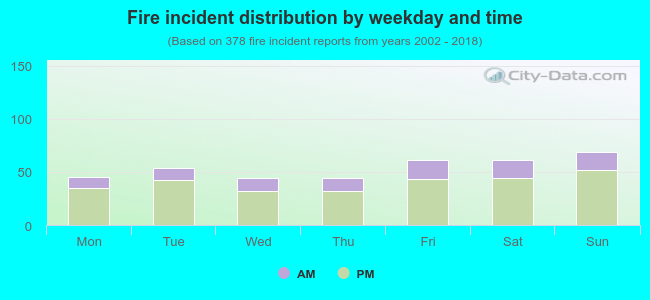 25.9% incidents where reported in the morning and 74.1% in the evening. The most fires (18.3%) took place on Sunday, and the least (11.6%) on Wednesday.
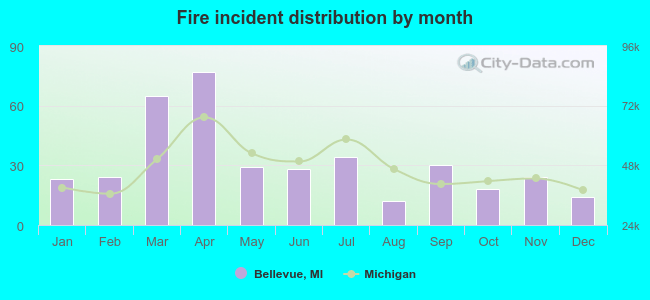 According to the 378 fire incidents from years 2002 - 2018 most fires (20.4%) took place during April, and the least (3.2%) in August.
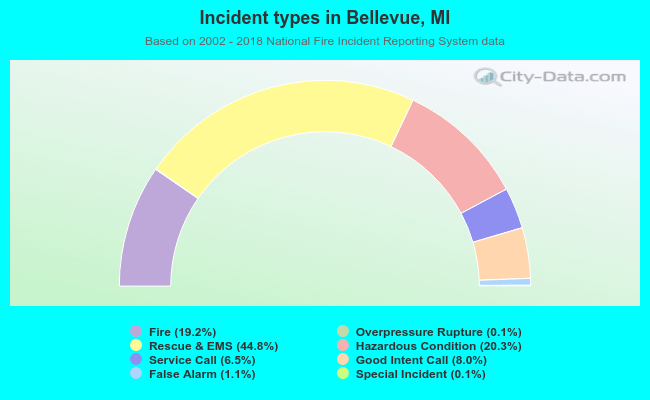 Out of all 1,967 cases reported during the years 2002 - 2018, the most belonged to the categories: Rescue & EMS (44.8%), Hazardous Condition (20.3%), and Fire (19.2%).
 When looking into fire subcategories, the most incidents belonged to: Outside Fires (39.7%), and Structure Fires (37.6%).