Bellevue: Fire Incidents, Nebraska (NE)
Where are fire incidents reported in Bellevue, NE
Something went wrong! Please refresh the page.
| Fire incidents reported | |
|---|---|
| Sreet name | Count |
| FORT CROOK RD | 118 |
| GALVIN RD | 114 |
| HANCOCK ST | 72 |
| CHANDLER RD | 62 |
| MISSION AVE | 60 |
| CORNHUSKER RD | 48 |
| KANSAS DR | 44 |
| CHATEAU DR | 40 |
| JFK EXPY | 38 |
| WASHINGTON ST | 38 |
| FRANKLIN ST | 34 |
| AMERADO BLVD | 32 |
| LEE DR | 32 |
| WAYNE ST | 32 |
| HACKBERRY CT | 30 |
| 25 ST | 28 |
| HARRISON ST | 28 |
| BELLEVUE BLVD | 26 |
| EMILINE ST | 26 |
| MAIN ST | 26 |
| 36 ST | 24 |
| GOLDEN BLVD | 24 |
| SAMSON WAY | 24 |
| 25TH ST | 22 |
| CEDAR ISLAND RD | 22 |
| TWIN CREEK DR | 22 |
| GERTRUDE ST | 20 |
| JACKSON ST | 20 |
| JEFFERSON ST | 20 |
| BETZ RD | 18 |
| Other | 304 |
2002 - 2018 National Fire Incident Reporting System (NFIRS) incidents
- Incident types reported to NFIRS in Bellevue, NE
- 15,35773.0%Rescue & EMS
- 1,4486.9%Fire
- 1,1665.5%Hazardous Condition
- 1,1615.5%False Alarm
- 9494.5%Good Intent Call
- 9254.4%Service Call
- 280.1%Special Incident
- Fire incident types reported to NFIRS in Bellevue, NE
- 65645.3%Structure Fires
- 38826.8%Outside Fires
- 28019.3%Mobile Property/Vehicle Fires
- 1248.6%Other
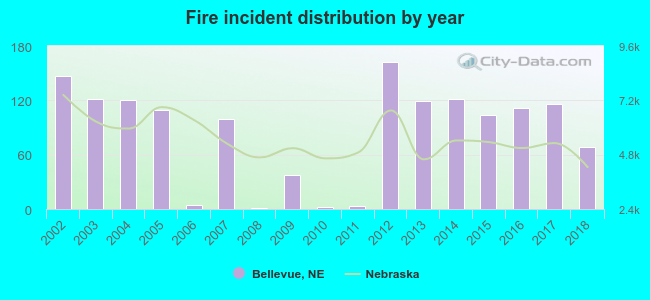 According to the data from the years 2002 - 2018 the average number of fires per year is 85. The highest number of fires - 162 took place in 2012, and the least - 1 in 2008. The data has a dropping trend.
The average number of yearly fire incidents per 10k residents in Bellevue, NE compared to nearest cities:
(Note: Based on data for the last 3 years, including only cities with population 5,000 and above)
| Bellevue: | 18.4 |
| Papillion: | 2.7 |
| La Vista: | 3.8 |
| Ralston: | 8.3 |
| Omaha: | 35.9 |
| Plattsmouth: | 41.1 |
| Gretna: | 61.7 |
| Elkhorn: | 1.5 |
| Blair: | 15.4 |
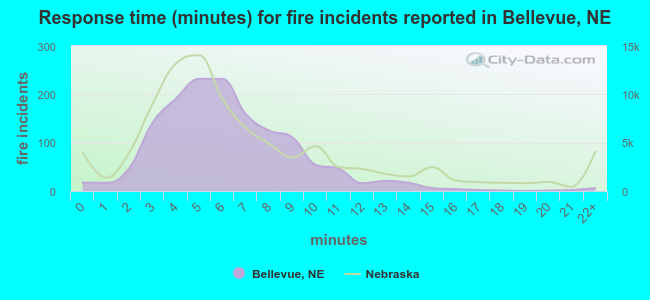 The median response time based on all reported fire incidents is 6 minutes. This is about the same as the state median value.
The median response time in Bellevue, NE compared to nearest cities:
(Note: Based on data for all years, including only cities with at least 500 fire incidents)
| Bellevue: | 6 minutes |
| Council Bluffs: | 7 minutes |
| Omaha: | 5 minutes |
| Boys Town: | 4 minutes |
| Ashland: | 8 minutes |
| Nebraska City: | 5 minutes |
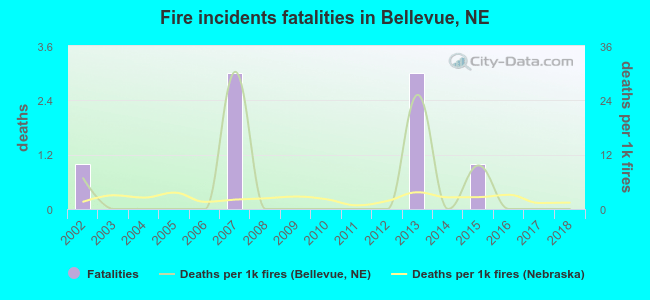 According to the data from the years 2002 - 2018 the average number of fire-related yearly deaths is 0. The highest number of deaths - 3 took place in 2007, and the lowest - 0 in 2003. The data has a dropping trend.
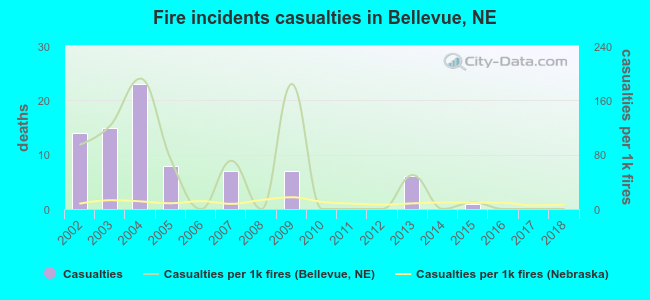 According to the reports from the years 2002 - 2018 the average number of fire-related casualties per year is 5. The highest number of reported casualties - 23 took place in 2004, and the lowest - 0 in 2006. The data has a declining trend.
The average number of casualties per 1,000 fire incidents is 47. This indicator was the highest - 192 in 2004, and the lowest 0 in 2006. The trend for injuries per 1,000 fires is declining. Compared to the state value the number of casualties per 1,000 fire incidents is much higher.
According to the reports from the years 2002 - 2018 the average number of fire-related casualties per year is 5. The highest number of reported casualties - 23 took place in 2004, and the lowest - 0 in 2006. The data has a declining trend.
The average number of casualties per 1,000 fire incidents is 47. This indicator was the highest - 192 in 2004, and the lowest 0 in 2006. The trend for injuries per 1,000 fires is declining. Compared to the state value the number of casualties per 1,000 fire incidents is much higher.Casualties per 1,000 incidents in Bellevue, NE compared to nearest cities:
(Note: Based on data for all years, including only cities with at least 500 fire incidents)
| Bellevue: | 55.9 |
| Council Bluffs: | 8.9 |
| Omaha: | 9.0 |
| Boys Town: | 0.0 |
| Ashland: | 0.0 |
| Nebraska City: | 3.5 |
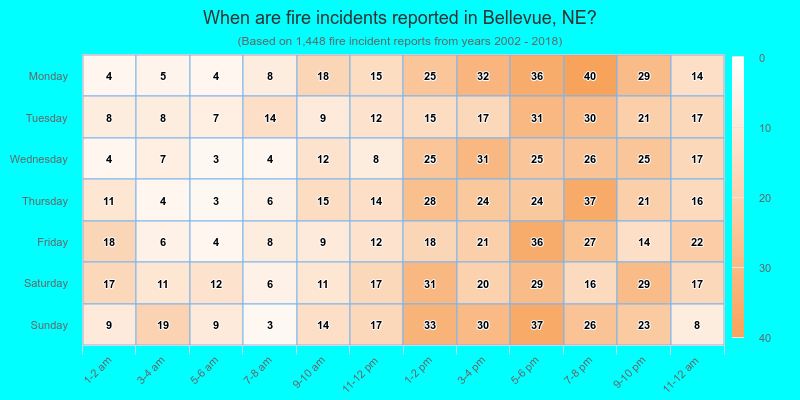
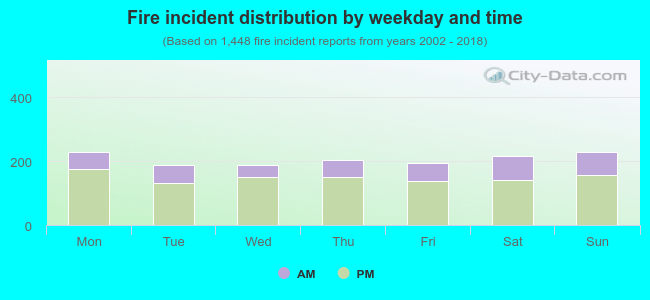 28.0% incidents where reported in the morning and 72.0% in the evening. The most fires (15.9%) took place on Monday, and the least (12.9%) on Wednesday.
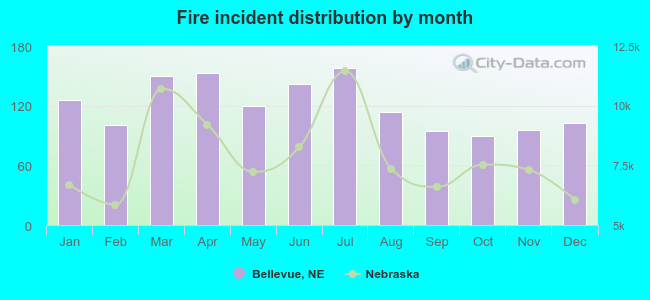 According to the 1,448 fire incident reports from years 2002 - 2018 most fires (10.9%) took place during July, and the least (6.2%) in October.
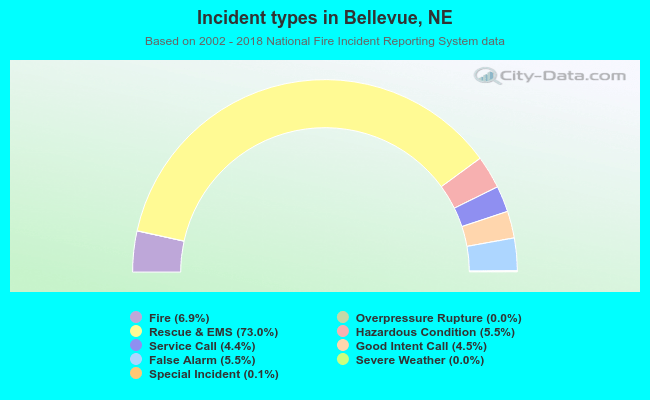 Out of all 21,042 cases reported during the years 2002 - 2018, the most belonged to the categories: Rescue & EMS (73.0%), Fire (6.9%), and Hazardous Condition (5.5%).
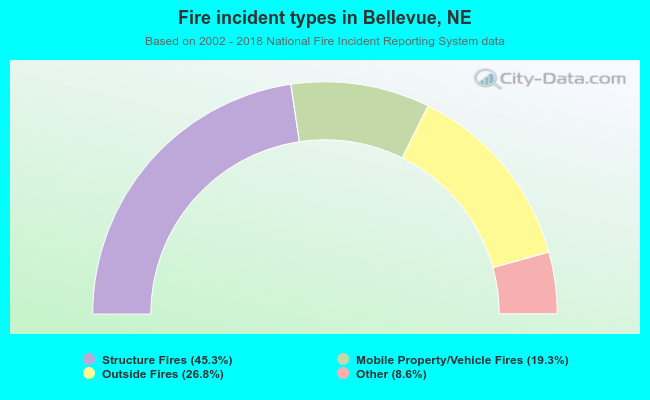 When looking into fire subcategories, the most reports belonged to: Structure Fires (45.3%), and Outside Fires (26.8%).