| Fire incidents reported |
|---|
| Sreet name | Count |
|---|
| 151 HWY | 14 | | 24192 LAKE JOY LN | 6 | | CTY G | 6 | | CTY G HWY | 6 | | UNION ST | 6 | | 12516 MADEN RD | 4 | | 14810 HWY 126 HWY | 4 | | 15TH | 4 | | 16350 BRUNTON LN | 4 | | 17330 BETHAL GROVE RD | 4 | | HWY 151 | 4 | | PARK ST | 4 | | TRUMAN ROAD | 4 | | 102 SOUTH ST ST | 2 | | 109 SOUTH MND | 2 | | 11791 COUNY RD I | 2 | | 12516 MADDEN ROAD | 2 | | 13192 CTY X HWY | 2 | | 13260 126 | 2 | | 14127 CLAYTON LANE | 2 | | 14861 PRAIRIE RD | 2 | | 15548 CTY O | 2 | | 16402 CTY X HWY | 2 | | 17015 BETHAL GROVE RD | 2 | | 17150 LIBERTY RD | 2 |
| | | Fire incidents reported |
|---|
| Sreet name | Count |
|---|
| 17330 BETHAL GROVE RD | 2 | | 18273 COTTAGE INN RD | 2 | | 18273 COTTAGE INN RD | 2 | | 18450 BETHAL GROVE RD | 2 | | 19975 CTY HWY G | 2 | | 20800 COTTAGE INN RD | 2 | | 20825 HWY 151 | 2 | | 218 PARK ST | 2 | | 21821 JONESBRANCH RD | 2 | | 222 CHESNUT ST | 2 | | 22390 TRUMAN RD | 2 | | 22770 TRUMAN RD | 2 | | 22830 CTY G | 2 | | 22830 RUSSEL RD | 2 | | 23063 CTY G | 2 | | 23232 TRUMAN RD | 2 | | 23570 CTY G HWY | 2 | | 23570 CTY HWY G | 2 | | 24125 CTY F | 2 | | 24192 LAKE JOY LN | 2 | | 24192 LAKR JOY LN | 2 | | 24558 BURR OAK RD RD | 2 | | 25238 COTTAGE INN RD | 2 | | 25248 | 2 | | 26184 JERICHO RD | 2 |
|
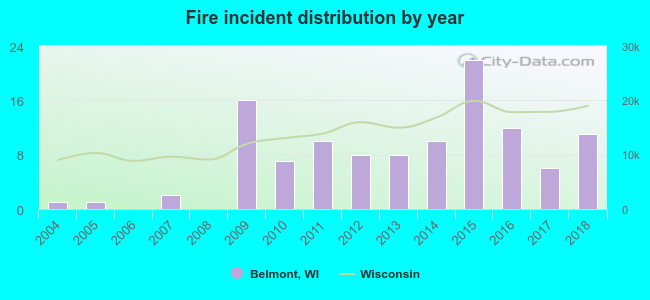 Based on the data from the years 2004 - 2018 the average number of fires per year is 8. The highest number of reported fire incidents - 22 took place in 2015, and the least - 0 in 2006. The data has a rising trend.
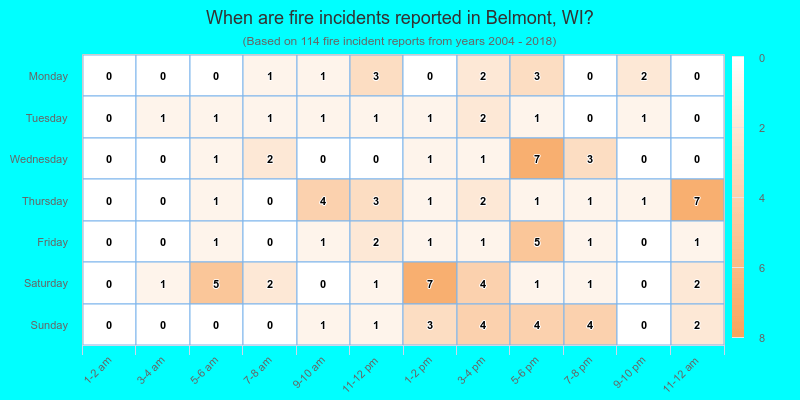
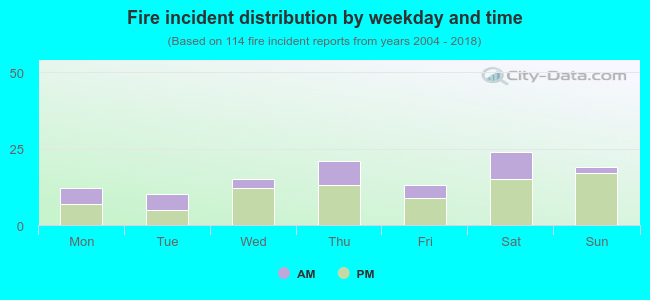 31.6% incidents where reported in the morning and 68.4% in the evening. The most fires (21.1%) took place on Saturday, and the least (8.8%) on Tuesday.
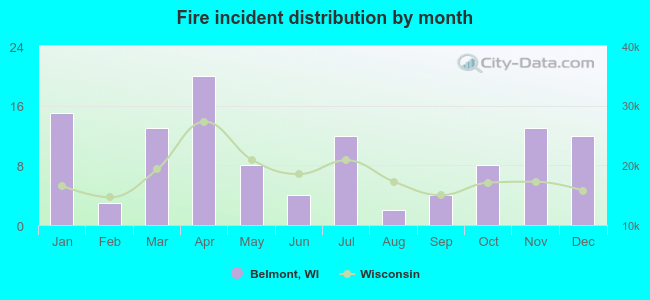 According to the 114 fire incident reports from years 2004 - 2018 most fires (17.5%) took place during April, and the least (1.8%) in August.
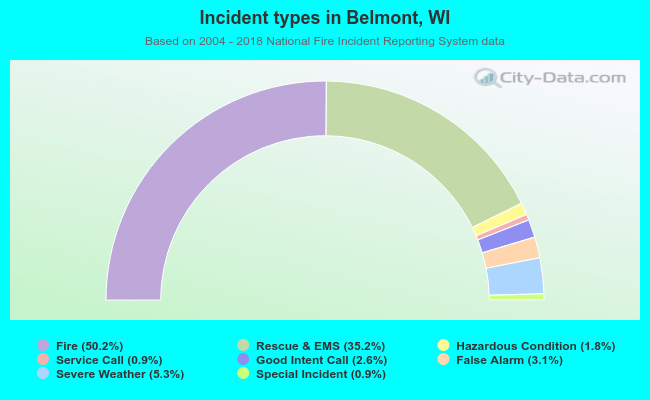 Out of all 227 cases reported during the years 2004 - 2018, the most belonged to the categories: Fire (50.2%), Overpressure Rupture (35.2%), and False Alarm (5.3%).
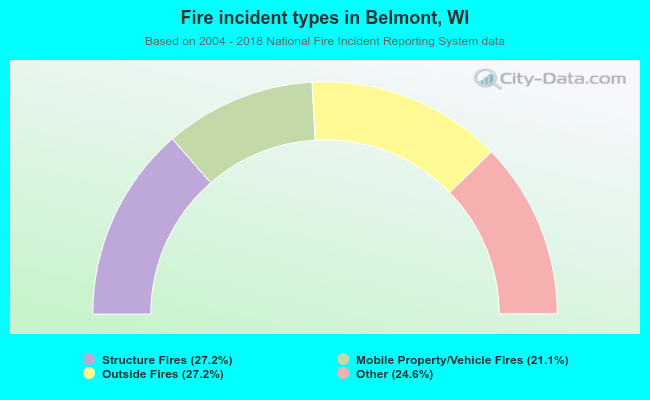 When looking into fire subcategories, the most reports belonged to: Structure Fires (27.2%), and Outside Fires (27.2%).