| Fire incidents reported |
|---|
| Sreet name | Count |
|---|
| HWY 113 | 16 | | TRAM ROAD | 16 | | HIGHWAY 113 | 14 | | 60 HWY | 12 | | STATE HIGHWAY 60 EAST | 12 | | 113 | 10 | | ROSS HOLLOW ROAD | 10 | | WILSON STREET | 10 | | HIGHWAY 300 | 8 | | STATE HIGHWAY 113 | 8 | | 4200 HWY 60 EAST | 6 | | ARKANSAS 113 HWY | 6 | | COPELAND ROAD | 6 | | HIGHWAY 60 EAST | 6 | | HWY 60 EAST | 6 | | JOHN MARIE DRIVE | 6 | | SUNSHINE FARMS | 6 | | WILSON | 6 | | 176 ROSS HOLLOW ROAD | 4 | | 60 HIGH | 4 | | BAILEY LANE | 4 | | BAYLOR HOUSE RD | 4 | | BREEZEWOOD ROAD | 4 | | COPELAND RD | 4 | | EAST 2ND STREET | 4 |
| | | Fire incidents reported |
|---|
| Sreet name | Count |
|---|
| FRONT | 4 | | FRONT ST | 4 | | GUNTHER ROAD | 4 | | HARRIS FARM RD | 4 | | HWY 113 SOUTH | 4 | | HWY. 60 EAST | 4 | | JESSIE ST | 4 | | JOHN ZULPO & REESE CREEK | 4 | | LEDWEDGE RD | 4 | | LOVERS LANE | 4 | | OLD DIXIE RD | 4 | | PANTHER DRIVE | 4 | | PINEY ROAD | 4 | | RANKIN CREEK | 4 | | RANKIN CREEK DRIVE | 4 | | RIVER RUN | 4 | | STATE HIGHWAY 113 SOUTH | 4 | | STATE HIGHWAY 60 | 4 | | STREET | 4 | | TANNER DRIVE | 4 | | TAYLOR CREEK ROAD | 4 | | TOADSUCK LANE | 4 | | TOADSUCK PARK | 4 | | UNDERWOOD RD | 4 | | UNDERWOOD ROAD | 4 |
|
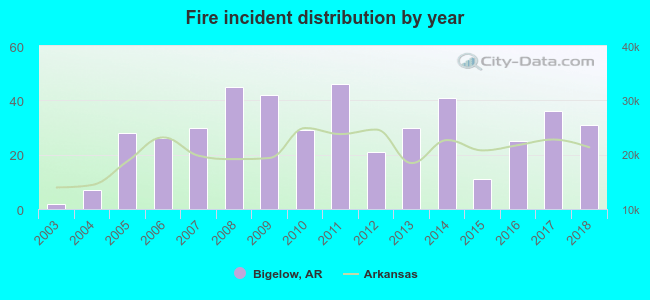 According to the data from the years 2003 - 2018 the average number of fire incidents per year is 28. The highest number of reported fires - 46 took place in 2011, and the least - 2 in 2003. The data has a growing trend.
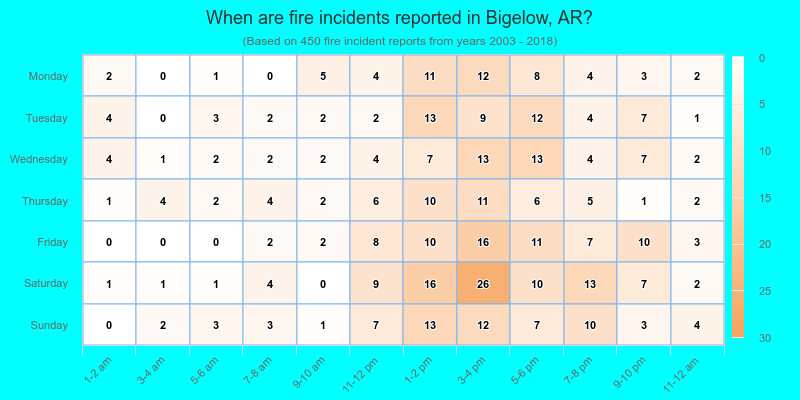
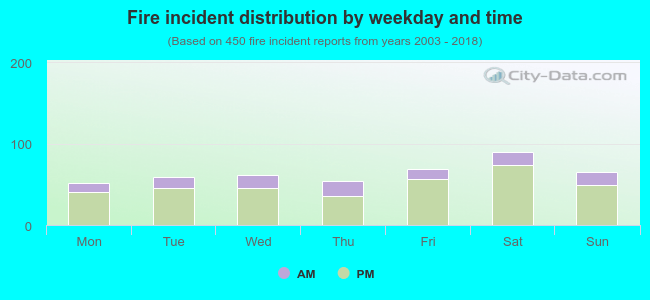 22.9% incidents where reported in the morning and 77.1% in the evening. The most fires (20.0%) took place on Saturday, and the least (11.6%) on Monday.
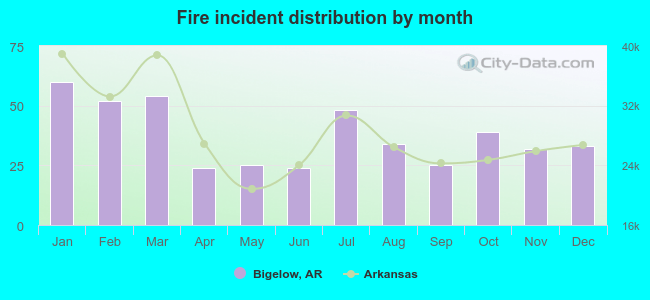 According to the 450 incident reports from years 2003 - 2018 most fires (13.3%) took place during January, and the least (5.3%) in April.
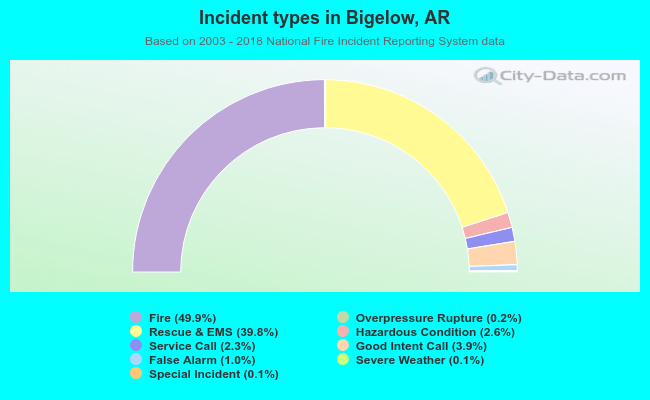 Out of all 901 cases reported during the years 2003 - 2018, the most belonged to the categories: Fire (49.9%), Rescue & EMS (39.8%), and Good Intent Call (3.9%).
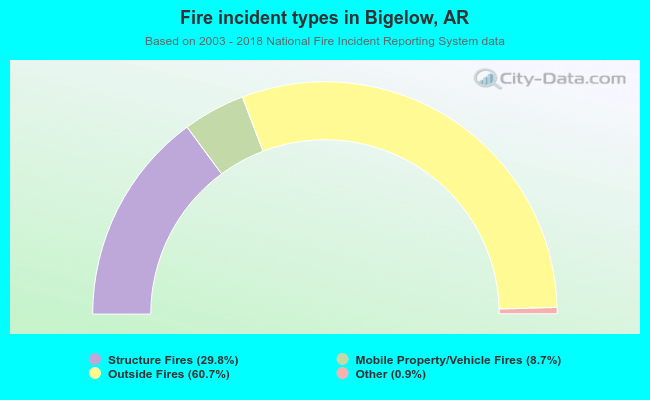 When looking into fire subcategories, the most reports belonged to: Outside Fires (60.7%), and Structure Fires (29.8%).