Blooming Grove: Fire Incidents, Texas (TX)
Where are fire incidents reported in Blooming Grove, TX
Something went wrong! Please refresh the page.
|
| |||||||||||||||||||||||||||||||||||||||||||||||||||||||||||||||||||||||||||||||||||||||||||||||||||||||||||||
2002 - 2018 National Fire Incident Reporting System (NFIRS) incidents
- Incident types reported to NFIRS in Blooming Grove, TX
- 25739.4%Fire
- 22434.4%Rescue & EMS
- 639.7%Good Intent Call
- 588.9%Service Call
- 396.0%Hazardous Condition
- 60.9%False Alarm
- 20.3%Overpressure Rupture
- 20.3%Special Incident
- 10.2%Severe Weather
- Fire incident types reported to NFIRS in Blooming Grove, TX
- 15560.3%Outside Fires
- 8131.5%Structure Fires
- 218.2%Mobile Property/Vehicle Fires
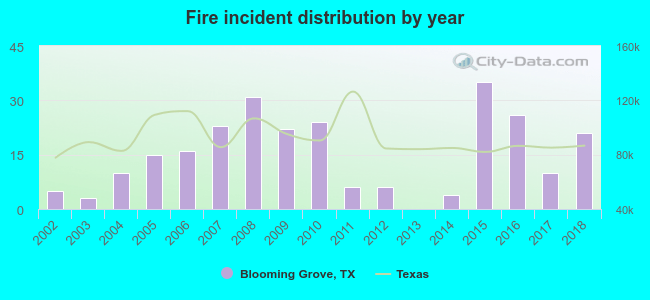 Based on the data from the years 2002 - 2018 the average number of fire incidents per year is 15. The highest number of reported fires - 35 took place in 2015, and the least - 0 in 2013. The data has an increasing trend.
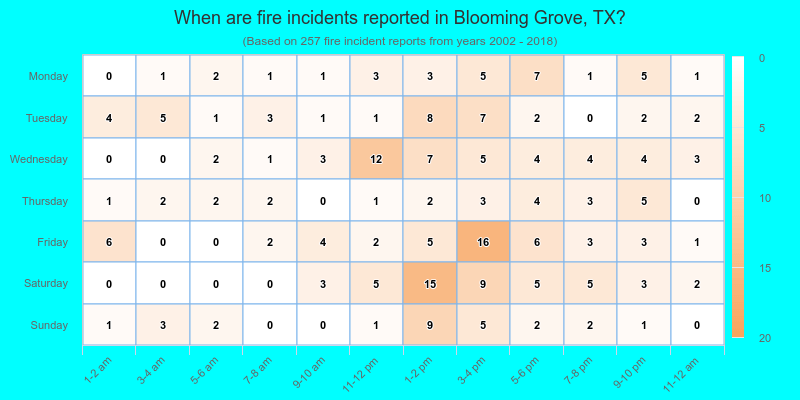
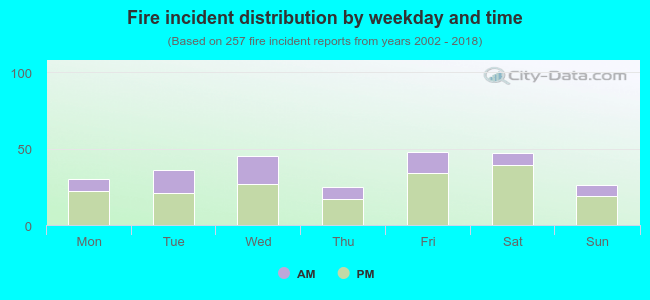 30.4% incidents where reported in the morning and 69.6% in the evening. The most fires (18.7%) took place on Friday, and the least (9.7%) on Thursday.
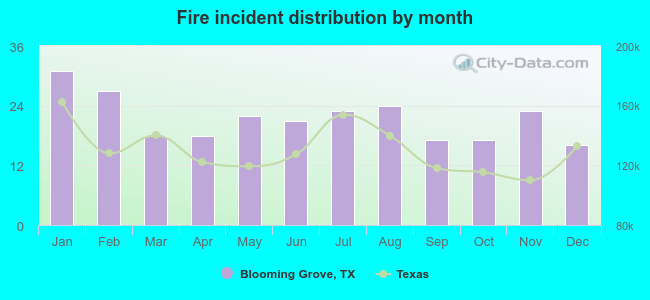 Based on the 257 fire incident reports from years 2002 - 2018 most fires (12.1%) took place during January, and the least (6.2%) in December.
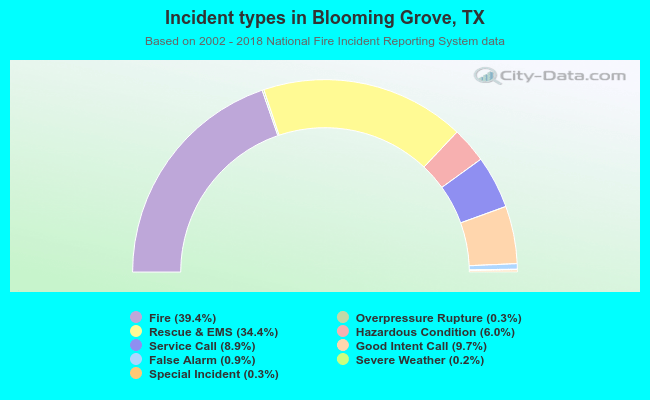 Out of all 652 cases reported during the years 2002 - 2018, the most belonged to the categories: Fire (39.4%), Rescue & EMS (34.4%), and Good Intent Call (9.7%).
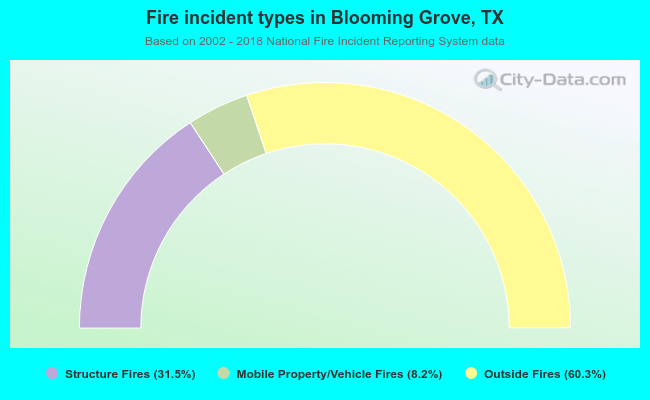 When looking into fire subcategories, the most incidents belonged to: Outside Fires (60.3%), and Structure Fires (31.5%).