| Fire incidents reported |
|---|
| Sreet name | Count |
|---|
| CHESTNUT | 14 | | HWY 9 HWY | 14 | | 11TH RD | 12 | | 77 HWY | 12 | | MAIN ST | 12 | | YONDER 2500 | 12 | | 13TH RD | 10 | | 8TH RD | 10 | | 8TH ROAD | 10 | | CLEBURNE PARK RD | 10 | | GENESEE | 10 | | VILANDER RD | 10 | | 14TH RD | 8 | | EAST RIVER ROAD RD | 8 | | LINCOLN | 8 | | 15TH RD | 6 | | APACHE LN 2700 | 6 | | SUNFLOWER 2000 | 6 | | TUMBLEWEED 2100 | 6 | | US 77 | 6 | | UTAH 2200 | 6 | | 10TH RD | 4 | | 11TH ST | 4 | | 12TH AND ZENITH | 4 | | 5TH ST | 4 |
| | | Fire incidents reported |
|---|
| Sreet name | Count |
|---|
| 829 YONDER ROAD | 4 | | 9TH RD | 4 | | BOBCAT LN 2800 | 4 | | CHRISTENSON HL | 4 | | CYCLONE 2900 | 4 | | FLAT ROCK RD | 4 | | HWY 77 | 4 | | SWEDE CREEK RD | 4 | | VILANDER RD | 4 | | VISTA RD | 4 | | WEST RIVER ROAD RD | 4 | | WESTERN AVE | 4 | | YOEMAN RD RD | 4 | | 1 ST AND GENESEE | 2 | | 1009 SOUTH MAIN | 2 | | 104 GENESEE | 2 | | 106 N PROSPECT COURT | 2 | | 106 PROSPECT COURT | 2 | | 10TH ROAD | 2 | | 10TH TERRACE | 2 | | 11TH AND TUMBLEWEED | 2 | | 11TH AND ZENITH | 2 | | 11TH ROAD AND SUNFLOWER | 2 | | 12 TH ROAD AND HWY 9 | 2 | | |
|
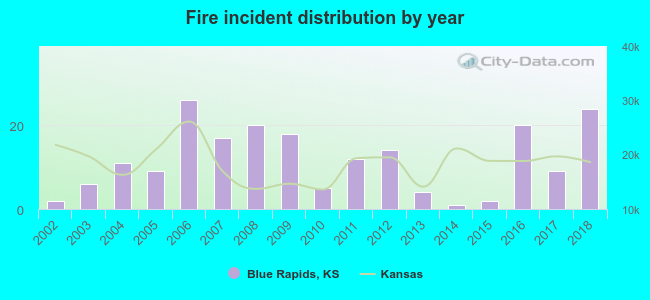 According to the data from the years 2002 - 2018 the average number of fires per year is 12. The highest number of fires - 26 took place in 2006, and the least - 1 in 2014. The data has an increasing trend.
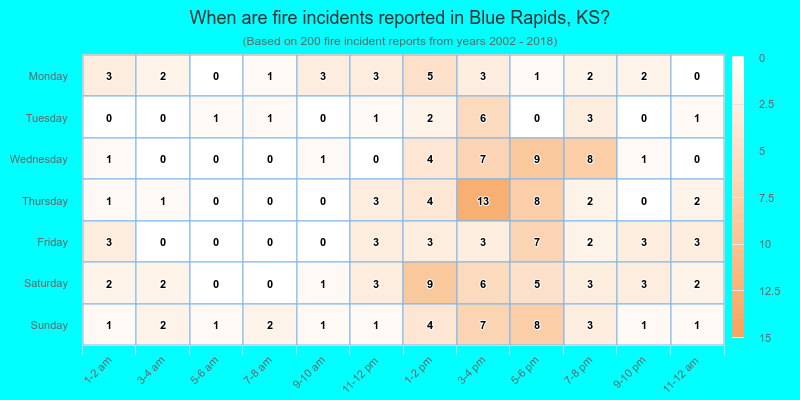
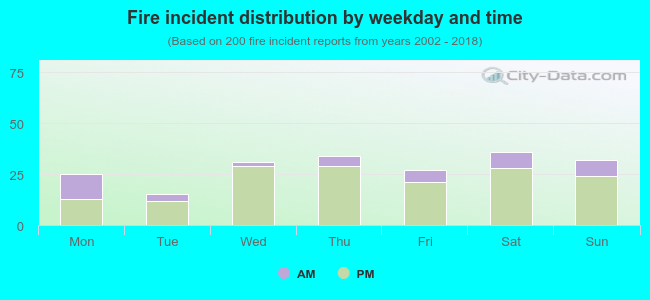 22.0% incidents where reported in the morning and 78.0% in the evening. The most fires (18.0%) took place on Saturday, and the least (7.5%) on Tuesday.
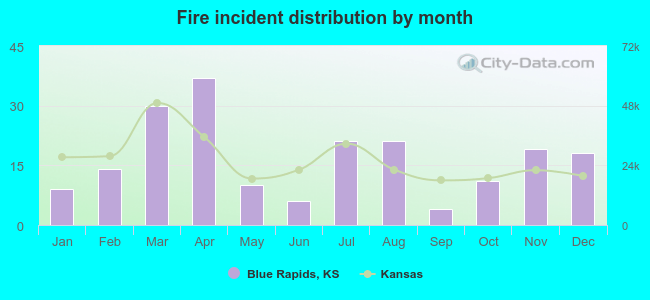 Based on the 200 fire incident reports from years 2002 - 2018 most fires (18.5%) took place during April, and the least (2.0%) in September.
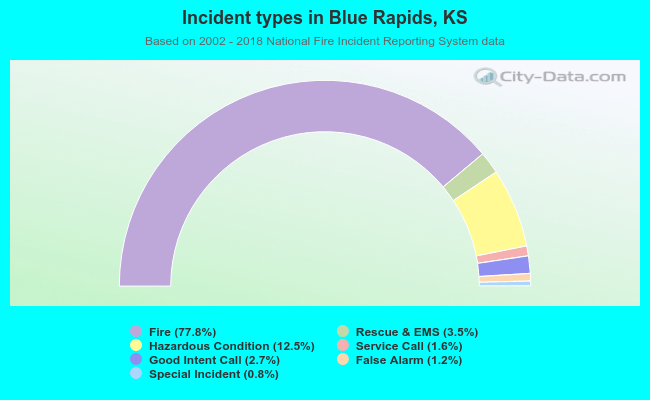 Out of all 257 cases reported during the years 2002 - 2018, the most belonged to the categories: Fire (77.8%), Rescue & EMS (12.5%), and Overpressure Rupture (3.5%).
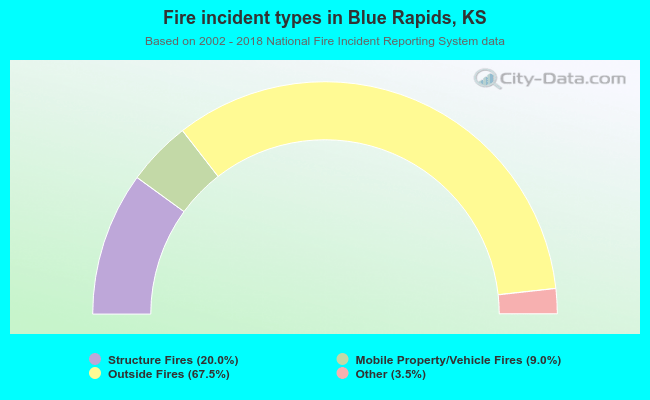 When looking into fire subcategories, the most reports belonged to: Outside Fires (67.5%), and Structure Fires (20.0%).