Brentwood: Fire Incidents, New Hampshire (NH)
Where are fire incidents reported in Brentwood, NH
Something went wrong! Please refresh the page.
|
| |||||||||||||||||||||||||||||||||||||||||||||||||||||||||||||||||||||||||||||||||||||||||||||||||||||||||||||
2002 - 2018 National Fire Incident Reporting System (NFIRS) incidents
- Incident types reported to NFIRS in Brentwood, NH
- 1,63945.9%Rescue & EMS
- 54815.3%Hazardous Condition
- 45212.7%False Alarm
- 42511.9%Fire
- 3178.9%Good Intent Call
- 1825.1%Service Call
- 40.1%Overpressure Rupture
- Fire incident types reported to NFIRS in Brentwood, NH
- 22452.7%Structure Fires
- 10424.5%Outside Fires
- 6214.6%Mobile Property/Vehicle Fires
- 358.2%Other
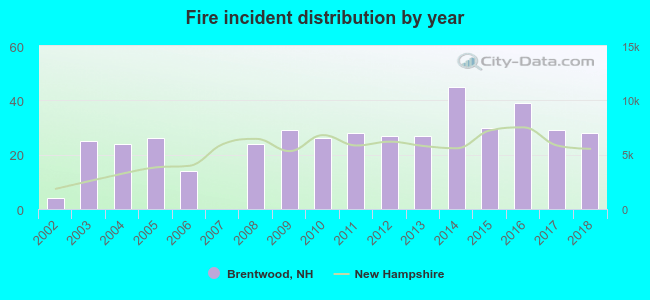 According to the data from the years 2002 - 2018 the average number of fire incidents per year is 25. The highest number of fires - 45 took place in 2014, and the least - 0 in 2007. The data has an increasing trend.
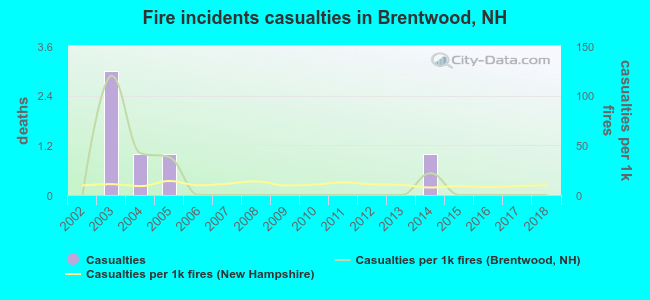 According to the data from the years 2002 - 2018 the average number of fire-related casualties per year is 0. The highest number of reported injuries - 3 took place in 2003, and the lowest - 0 in 2002. The data has a constant trend.
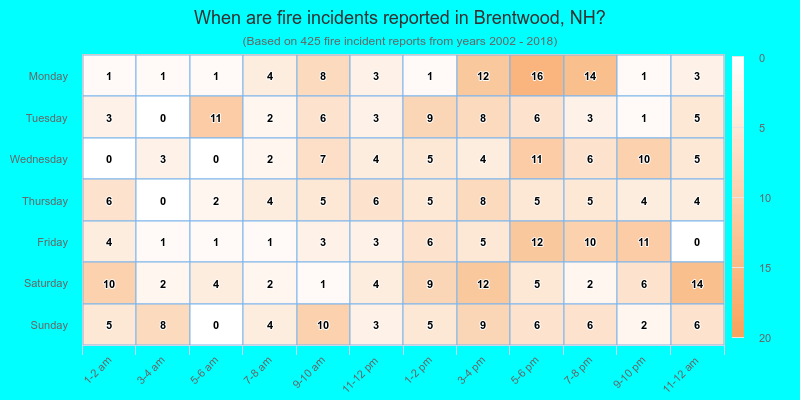
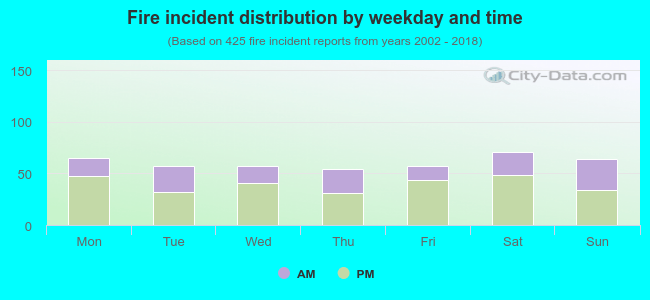 34.8% incidents where reported in the morning and 65.2% in the evening. The most fires (16.7%) took place on Saturday, and the least (12.7%) on Thursday.
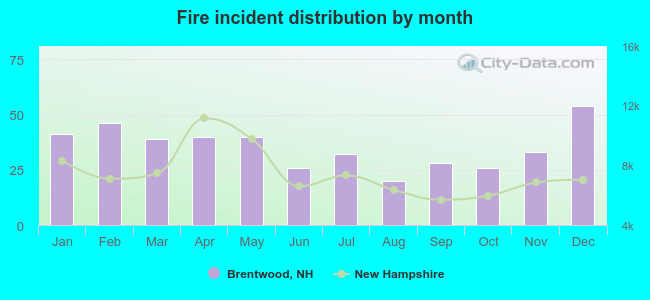 According to the 425 fire incidents from years 2002 - 2018 most fires (12.7%) took place during December, and the least (4.7%) in August.
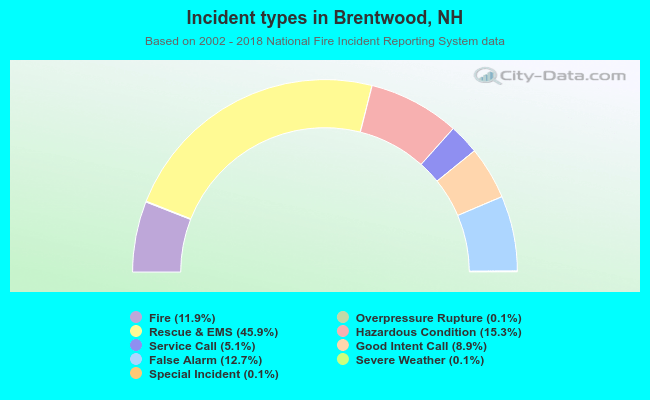 Out of all 3,572 cases reported during the years 2002 - 2018, the most belonged to the categories: Rescue & EMS (45.9%), Hazardous Condition (15.3%), and False Alarm (12.7%).
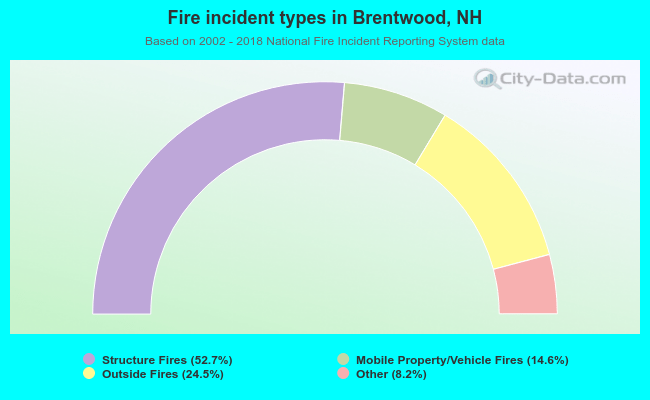 When looking into fire subcategories, the most incidents belonged to: Structure Fires (52.7%), and Outside Fires (24.5%).