Bridgehampton: Fire Incidents, New York (NY)
Where are fire incidents reported in Bridgehampton, NY
Something went wrong! Please refresh the page.
|
| |||||||||||||||||||||||||||||||||||||||||||||||||||||||||||||||||||||||||||||||||||||||||||||||||||||||||||||
2004 - 2018 National Fire Incident Reporting System (NFIRS) incidents
- Incident types reported to NFIRS in Bridgehampton, NY
- 93343.0%Rescue & EMS
- 75434.7%False Alarm
- 1567.2%Hazardous Condition
- 1396.4%Fire
- 1376.3%Good Intent Call
- 321.5%Special Incident
- 200.9%Service Call
- Fire incident types reported to NFIRS in Bridgehampton, NY
- 9467.6%Structure Fires
- 3122.3%Outside Fires
- 107.2%Mobile Property/Vehicle Fires
- 42.9%Other
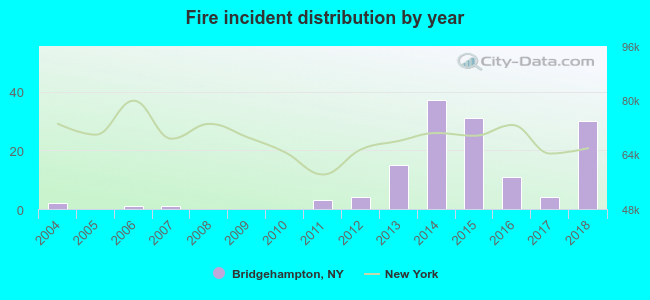 Based on the data from the years 2004 - 2018 the average number of fire incidents per year is 9. The highest number of fire incidents - 37 took place in 2014, and the least - 0 in 2005. The data has an increasing trend.
 33.8% incidents where reported in the morning and 66.2% in the evening. The most fires (25.9%) took place on Saturday, and the least (5.8%) on Wednesday.
 Based on the 139 fires from years 2004 - 2018 most fires (18.0%) took place during July, and the least (2.2%) in January.
 Out of all 2,171 cases reported during the years 2004 - 2018, the most belonged to the categories: Overpressure Rupture (43.0%), Good Intent Call (34.7%), and Rescue & EMS (7.2%).
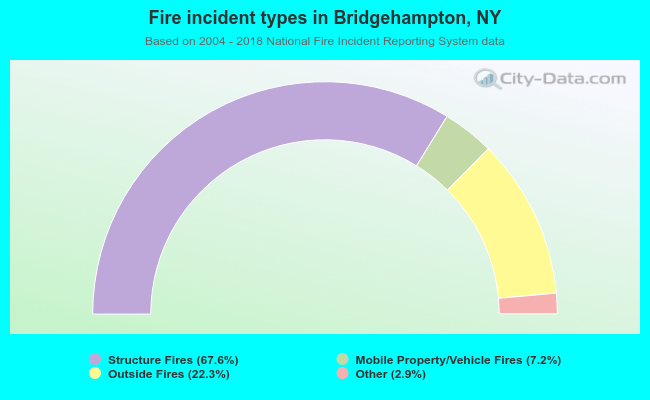 When looking into fire subcategories, the most reports belonged to: Structure Fires (67.6%), and Outside Fires (22.3%).