Bull Shoals: Fire Incidents, Arkansas (AR)
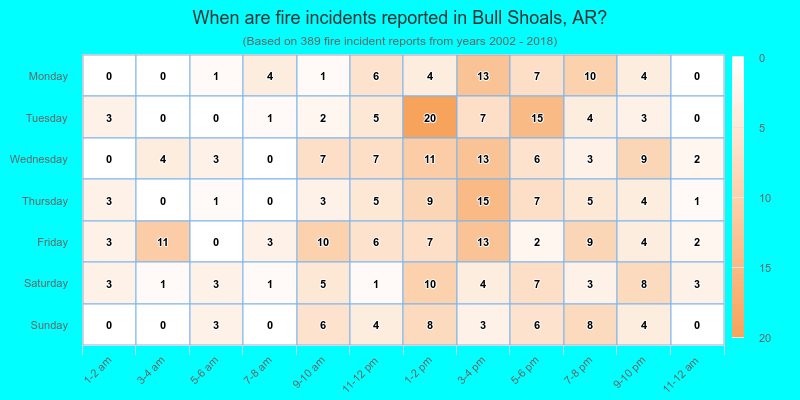
Where are fire incidents reported in Bull Shoals, AR
Something went wrong! Please refresh the page.
|
| |||||||||||||||||||||||||||||||||||||||||||||||||||||||||||||||||||||||||||||||||||||||||||||||||||||||||||||
| Other | 9 | |||||||||||||||||||||||||||||||||||||||||||||||||||||||||||||||||||||||||||||||||||||||||||||||||||||||||||||
2002 - 2018 National Fire Incident Reporting System (NFIRS) incidents
- Incident types reported to NFIRS in Bull Shoals, AR
- 94957.3%Rescue & EMS
- 38923.5%Fire
- 1257.5%Good Intent Call
- 915.5%Service Call
- 694.2%Hazardous Condition
- 251.5%False Alarm
- 60.4%Severe Weather
- 30.2%Special Incident
- Fire incident types reported to NFIRS in Bull Shoals, AR
- 19550.1%Outside Fires
- 15539.8%Structure Fires
- 215.4%Mobile Property/Vehicle Fires
- 184.6%Other
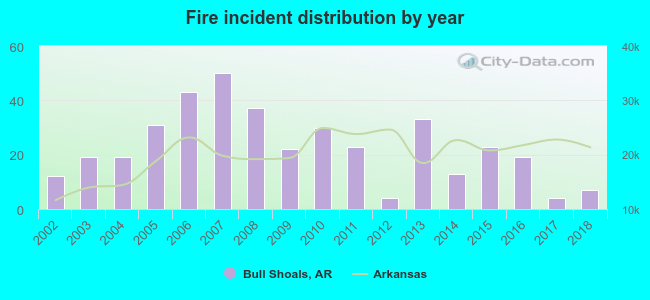 Based on the data from the years 2002 - 2018 the average number of fire incidents per year is 23. The highest number of fires - 50 took place in 2007, and the least - 4 in 2012. The data has a dropping trend.
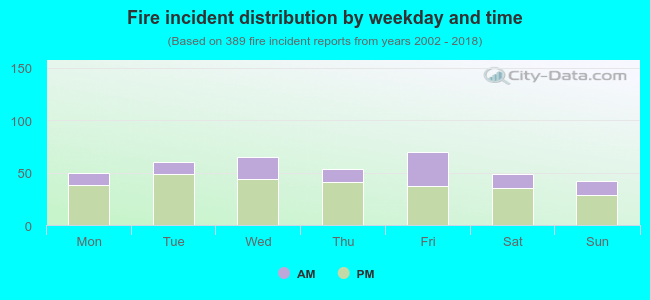 29.8% incidents where reported in the morning and 70.2% in the evening. The most fires (18.0%) took place on Friday, and the least (10.8%) on Sunday.
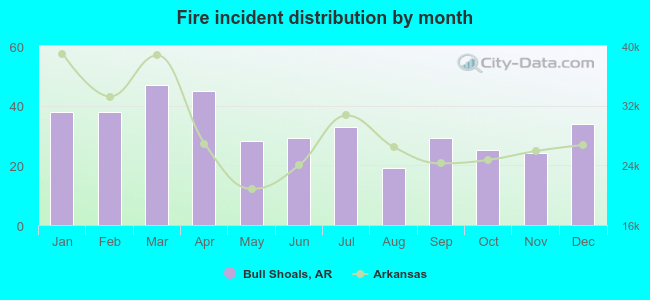 Based on the 389 incident reports from years 2002 - 2018 most fires (12.1%) took place during March, and the least (4.9%) in August.
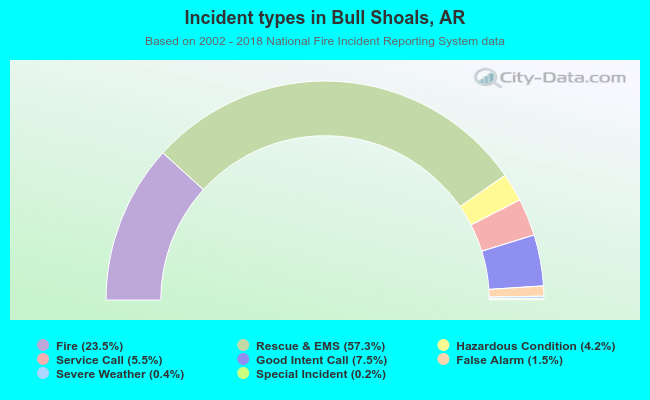 Out of all 1,657 cases reported during the years 2002 - 2018, the most belonged to the categories: Overpressure Rupture (57.3%), Fire (23.5%), and Service Call (7.5%).
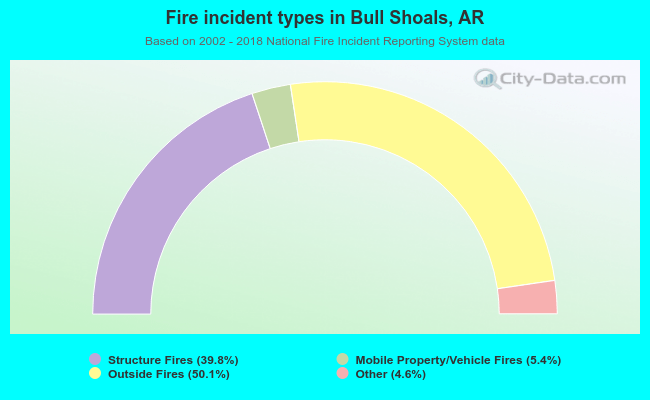 When looking into fire subcategories, the most reports belonged to: Outside Fires (50.1%), and Structure Fires (39.8%).