| Fire incidents reported |
|---|
| Sreet name | Count |
|---|
| EAST ROAD | 40 | | EAST ROAD RD | 32 | | STATE ROUTE 11 RT | 28 | | SPENCER ROAD RD | 24 | | STATE ROUTE 11 | 24 | | QUARRY ROAD RD | 18 | | SPENCER ROAD | 14 | | COUNTY ROUTE 23 | 10 | | EAST RD | 10 | | QUARRY ROAD | 10 | | COUNTY ROUTE 29 | 8 | | COUNTY ROUTE 29 RT | 8 | | COUNTY ROUTE 36 RT | 8 | | COVEYTOWN ROAD | 8 | | COVEYTOWN ROAD RD | 8 | | DEPOT STREET | 8 | | FINNEY ROAD | 8 | | MILL STREET ST | 8 | | SEVENTY ROAD | 8 | | ST RT 11 | 8 | | CALLAHAN ROAD RD | 6 | | COUNTY ROUTE 23 RT | 6 | | FINNEY ROAD RD | 6 | | PIKEVILLE RD | 6 | | QUARRY RD | 6 |
| | | Fire incidents reported |
|---|
| Sreet name | Count |
|---|
| SPENCER RD | 6 | | SPENCER RD | 6 | | VINCENT ROAD RD | 6 | | ATWOOD ROAD | 4 | | CALLAHAN RD | 4 | | CALLAHAN ROAD | 4 | | CNTY RT 24 | 4 | | COUNTY ROUTE 36 | 4 | | COVEYTOWN RD | 4 | | CTY RT 23 | 4 | | EAST RD RD | 4 | | MILL STREET | 4 | | PIKEVILLE ROAD | 4 | | ROUTE 11 | 4 | | SEVENTY ROAD RD | 4 | | STATE ROUTE 11 HWY | 4 | | TROUT RIVER ROAD RD | 4 | | VINCENT RD | 4 | | 267 CALHAN RD | 2 | | ATWOOD RD | 2 | | ATWOOD RD | 2 | | BRAINARDSVILLE RD. | 2 | | BURKE-BELLMONT TOWN LINE ROAD RD | 2 | | CNTY RT 36 | 2 | | |
|
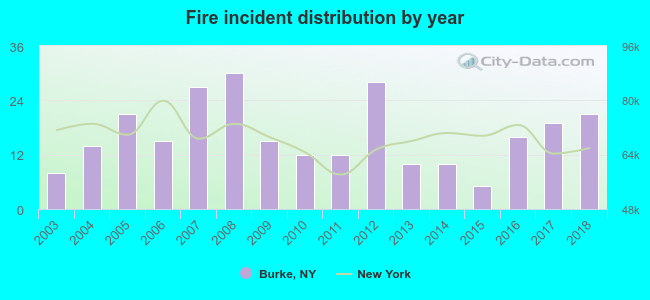 Based on the data from the years 2003 - 2018 the average number of fires per year is 16. The highest number of reported fires - 30 took place in 2008, and the least - 5 in 2015. The data has a rising trend.
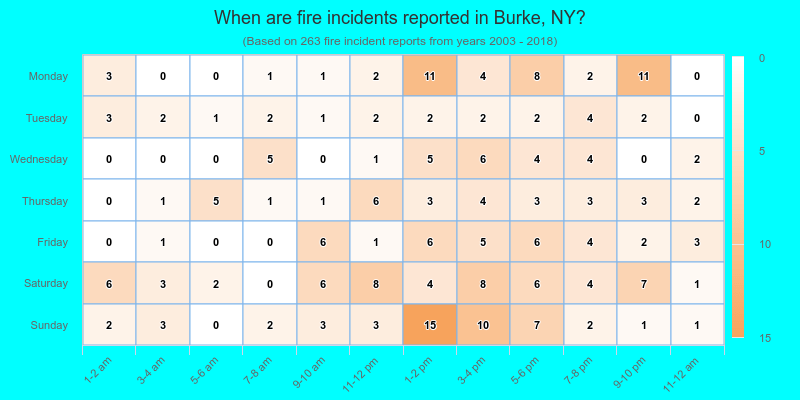
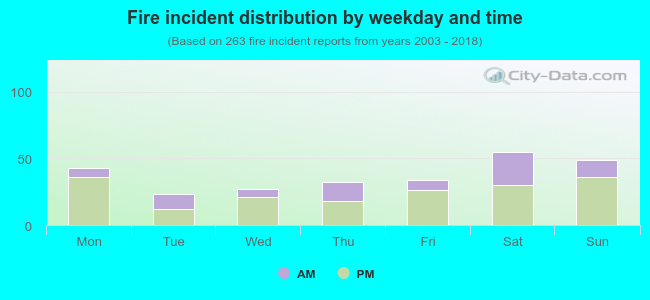 31.9% incidents where reported in the morning and 68.1% in the evening. The most fires (20.9%) took place on Saturday, and the least (8.7%) on Tuesday.
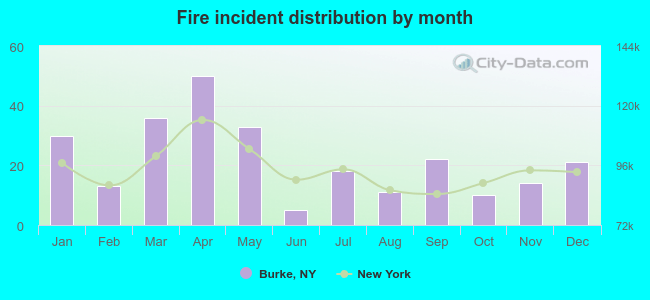 According to the 263 incident reports from years 2003 - 2018 most fires (19.0%) took place during April, and the least (1.9%) in June.
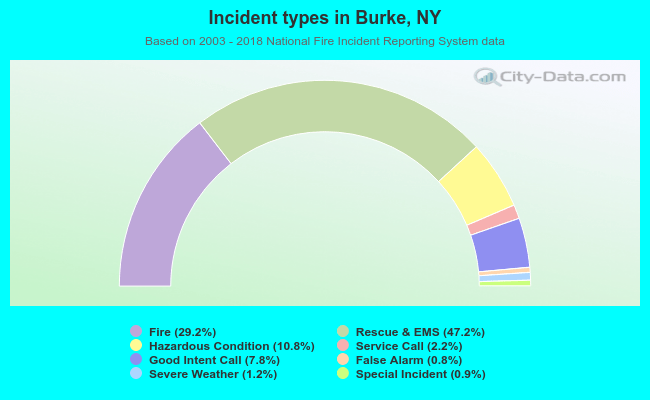 Out of all 901 cases reported during the years 2003 - 2018, the most belonged to the categories: Overpressure Rupture (47.2%), Fire (29.2%), and Rescue & EMS (10.8%).
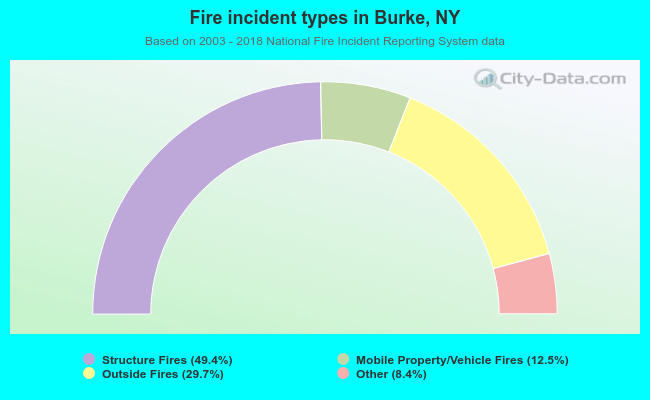 When looking into fire subcategories, the most reports belonged to: Structure Fires (49.4%), and Outside Fires (29.7%).