Burnet: Fire Incidents, Texas (TX)
Where are fire incidents reported in Burnet, TX
Something went wrong! Please refresh the page.
|
| |||||||||||||||||||||||||||||||||||||||||||||||||||||||||||||||||||||||||||||||||||||||||||||||||||||||||||||
| Other | 806 | |||||||||||||||||||||||||||||||||||||||||||||||||||||||||||||||||||||||||||||||||||||||||||||||||||||||||||||
2002 - 2018 National Fire Incident Reporting System (NFIRS) incidents
- Incident types reported to NFIRS in Burnet, TX
- 13,07774.3%Rescue & EMS
- 2,24612.8%Fire
- 1,1406.5%Good Intent Call
- 5793.3%Hazardous Condition
- 3101.8%False Alarm
- 2191.2%Service Call
- Fire incident types reported to NFIRS in Burnet, TX
- 1,49966.7%Outside Fires
- 47020.9%Structure Fires
- 2039.0%Mobile Property/Vehicle Fires
- 743.3%Other
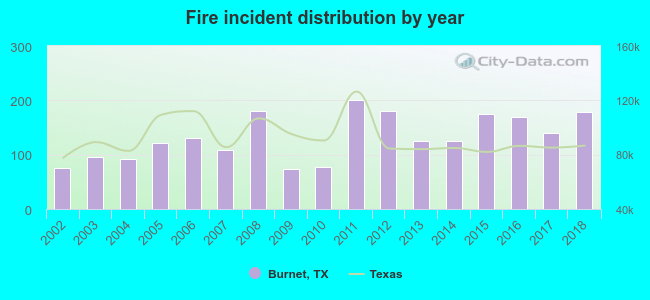 According to the data from the years 2002 - 2018 the average number of fires per year is 132. The highest number of fire incidents - 200 took place in 2011, and the least - 74 in 2009. The data has a growing trend.
The average number of yearly fire incidents per 10k residents in Burnet, TX compared to nearest cities:
(Note: Based on data for the last 3 years, including only cities with population 5,000 and above)
| Burnet: | 264.5 |
| Marble Falls: | 129.3 |
| Kingsland: | 7.7 |
| Lampasas: | 98.3 |
| Lago Vista: | 47.3 |
| Leander: | 38.0 |
| Cedar Park: | 18.8 |
| Lakeway: | 27.3 |
| Copperas Cove: | 38.1 |
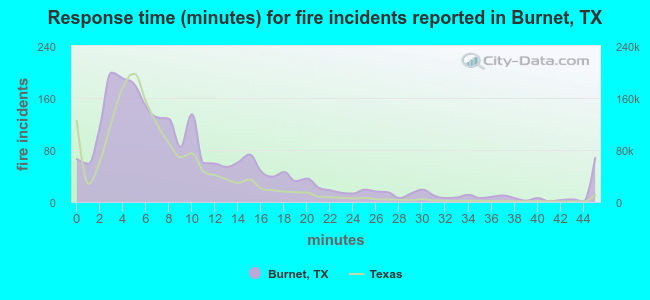 The median response time based on all reported fire incidents is 8 minutes. This is higher than the state median value.
The median response time in Burnet, TX compared to nearest cities:
(Note: Based on data for all years, including only cities with at least 500 fire incidents)
| Burnet: | 8 minutes |
| Bertram: | 9 minutes |
| Marble Falls: | 7 minutes |
| Liberty Hill: | 10 minutes |
| Lampasas: | 10 minutes |
| Leander: | 7 minutes |
| Kempner: | 13 minutes |
| Florence: | 10 minutes |
| Cedar Park: | 6 minutes |
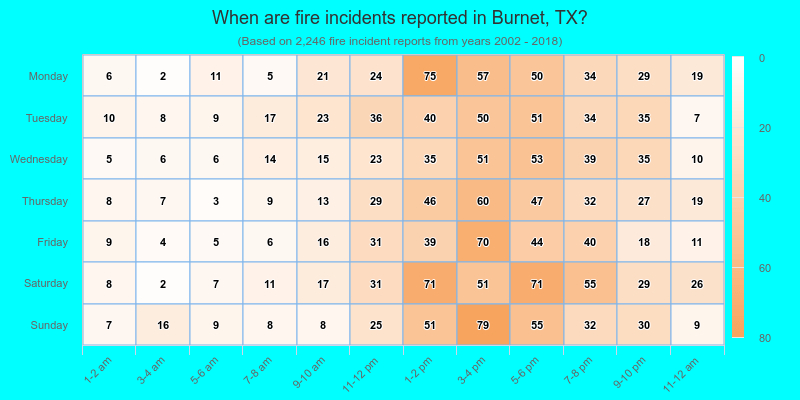
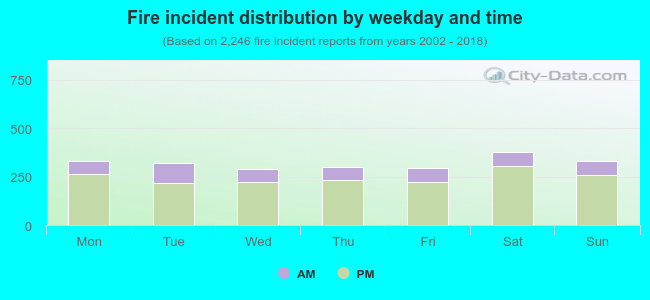 23.6% incidents where reported in the morning and 76.4% in the evening. The most fires (16.9%) took place on Saturday, and the least (13.0%) on Wednesday.
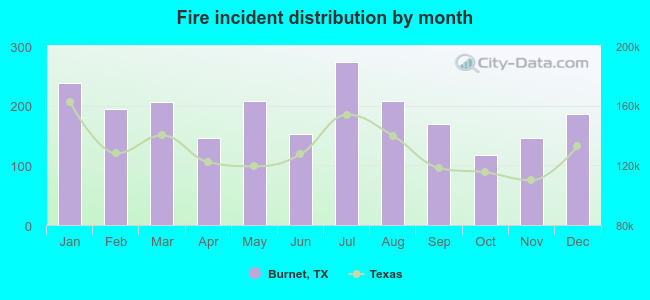 Based on the 2,246 fire incidents from years 2002 - 2018 most fires (12.2%) took place during July, and the least (5.3%) in October.
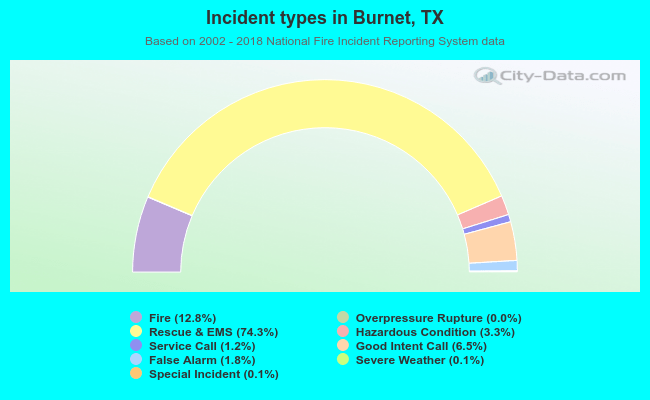 Out of all 17,607 cases reported during the years 2002 - 2018, the most belonged to the categories: Rescue & EMS (74.3%), Fire (12.8%), and Good Intent Call (6.5%).
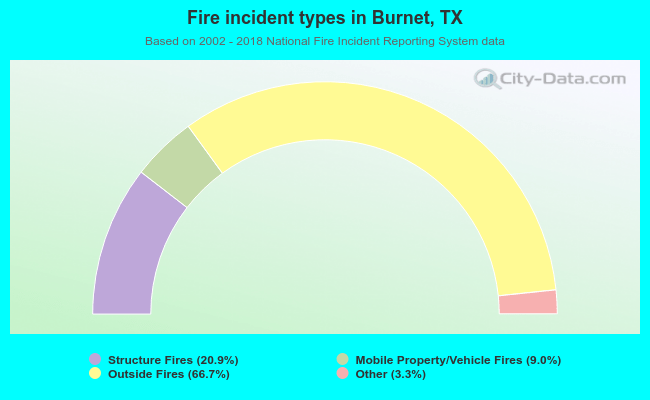 When looking into fire subcategories, the most incidents belonged to: Outside Fires (66.7%), and Structure Fires (20.9%).