| Fire incidents reported |
|---|
| Sreet name | Count |
|---|
| HWY 37 | 44 | | HWY U | 12 | | ST HWY 37 | 10 | | FARM ROAD 1090 | 8 | | FRM RD 2140 | 8 | | FRM RD 2150 | 8 | | STATE HIGHWAY 37 | 8 | | STATE HIGHWAY 37 HWY | 8 | | STATE HIGHWAY W | 8 | | FRM RD 1095 | 6 | | FRM RD 2115 | 6 | | HWY W | 6 | | STATE HIGHWAY U | 6 | | 1007 ST HWY U | 4 | | 10786 FRM RD 1075 | 4 | | 14584 ST HWY U | 4 | | 9560 ST HWY U | 4 | | FARM ROAD 1115 | 4 | | FARM ROAD 1155 | 4 | | FRM RD 1115 | 4 | | FRM RD 2125 | 4 | | FRM RD 2130 | 4 | | FRM RD 2142 | 4 | | 10106 BUS HWY 37 | 2 | | 10106 S BUS HWY 37 | 2 |
| | | Fire incidents reported |
|---|
| Sreet name | Count |
|---|
| 10106 S BUS. HWY 37 | 2 | | 10107 FIRST STREET | 2 | | 10202 EAST 5TH ST | 2 | | 10306 S BUS 37 | 2 | | 10309 ST HWY U | 2 | | 10401 MAPLE STR | 2 | | 10602 FRONT STREET | 2 | | 10702 CHESTNUT | 2 | | 10703 FIRST STR. | 2 | | 10703 TYLER STREET | 2 | | 10706 ST HWY U | 2 | | 10710 EAST FIRST STREET | 2 | | 10877 ST HWY 37 | 2 | | 11139 ST HWY 37 | 2 | | 11155 FRM RD 1142 | 2 | | 11164 ST HWY 37 | 2 | | 11352 FR 1112 | 2 | | 11352 FRM RD 1112 | 2 | | 11384 FRM RD 1155 | 2 | | 11679 PRIV RD 1084 | 2 | | 11766 FRM RD 2121 | 2 | | 11775 FRM RD 2120 | 2 | | 11909 FRM RD 2125 | 2 | | 11926 FRM RD 1052 | 2 | | |
|
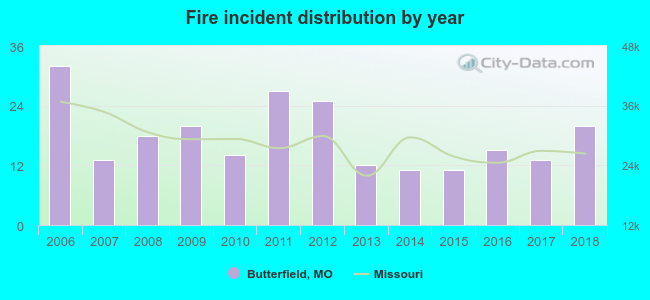 Based on the data from the years 2006 - 2018 the average number of fires per year is 18. The highest number of fire incidents - 32 took place in 2006, and the least - 11 in 2014. The data has a dropping trend.
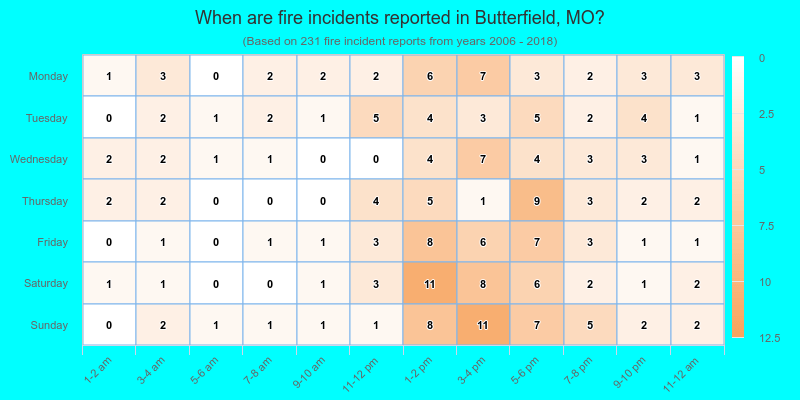
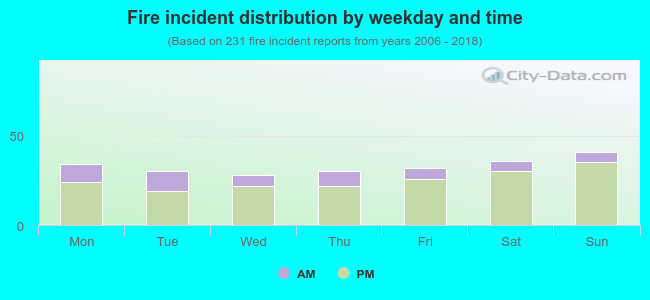 22.9% incidents where reported in the morning and 77.1% in the evening. The most fires (17.7%) took place on Sunday, and the least (12.1%) on Wednesday.
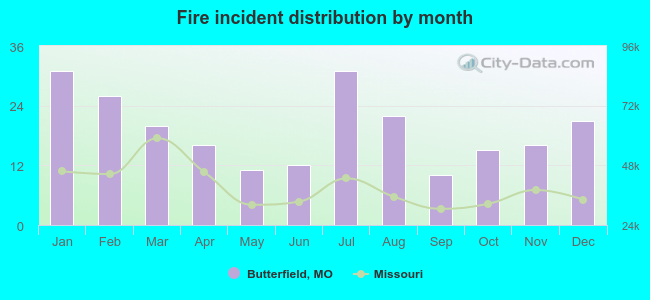 Based on the 231 incident reports from years 2006 - 2018 most fires (13.4%) took place during January, and the least (4.3%) in September.
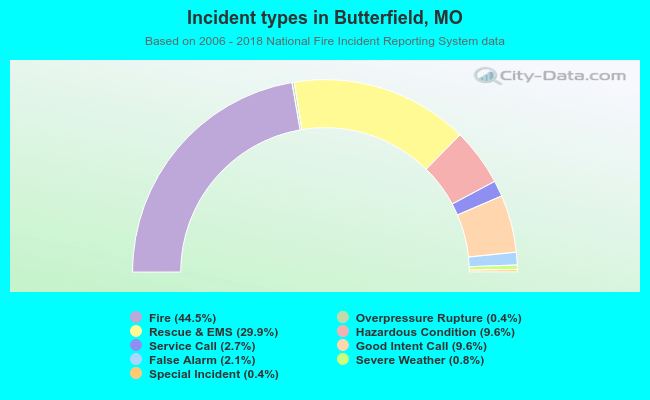 Out of all 519 cases reported during the years 2006 - 2018, the most belonged to the categories: Fire (44.5%), Rescue & EMS (29.9%), and Hazardous Condition (9.6%).
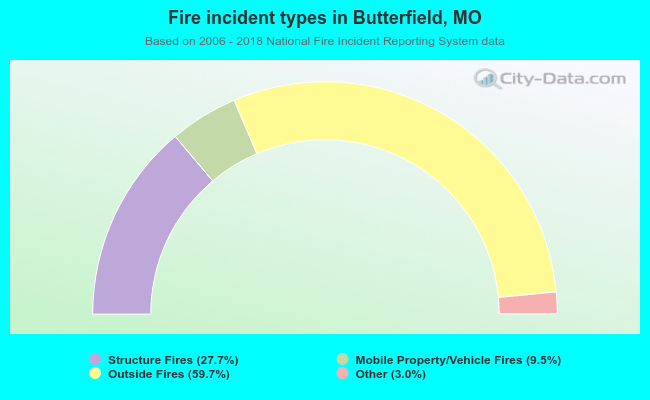 When looking into fire subcategories, the most reports belonged to: Outside Fires (59.7%), and Structure Fires (27.7%).