| Fire incidents reported |
|---|
| Sreet name | Count |
|---|
| WOODLAND DR | 28 | | STATE HIGHWAY 67 | 20 | | SUNSET DR | 20 | | COUNTY HIGHWAY F | 18 | | 45 HWY | 12 | | COUNTY HIGHWAY W | 12 | | STATE HIGHWAY 45 | 12 | | V HWY | 12 | | VISTA DR | 12 | | COUNTY HIGHWAY V | 10 | | HWY 45 | 10 | | MIDDLE RD | 10 | | MITCHELL RD | 10 | | ROLLING DR | 10 | | 67 HWY | 8 | | CLOVERLAND DR | 8 | | RUSTIC DR | 8 | | SCENIC DR | 8 | | TRIPLE S RD | 8 | | WOODLAND DRIVE | 8 | | AIRPORT RD | 6 | | CHAPEL HEIGHTS RD | 6 | | COUNTY HIGHWAY SS | 6 | | COUNTY ROAD V | 6 | | CTY HWY V | 6 |
| | | Fire incidents reported |
|---|
| Sreet name | Count |
|---|
| DOUBLE D RD | 6 | | DRUMLIN DR | 6 | | HAVEN DR | 6 | | RUSTIC DRIVE | 6 | | ST KILIAN DR | 6 | | ST KILLIAN DRIVE | 6 | | SUNSET DRIVE DR | 6 | | TIMBERLANE DR | 6 | | TOWN HALL RD | 6 | | US HWY 67 | 6 | | W HWY | 6 | | AIRPORT ROAD | 4 | | ARMSTRONG RD | 4 | | AUBURN ASHFORD ROAD | 4 | | BARTON RD | 4 | | BOY SCOUT DR | 4 | | CAMBELL DRIVE | 4 | | CENTURY DR | 4 | | CHERRY STREET | 4 | | COLUMBUS PARC CT | 4 | | COUNTRY AIRE DR | 4 | | COUNTRY AIRE DRIVE DR | 4 | | COUNTY HIGHWAY BB | 4 | | COUNTY HIGHWAY GGG | 4 | | |
|
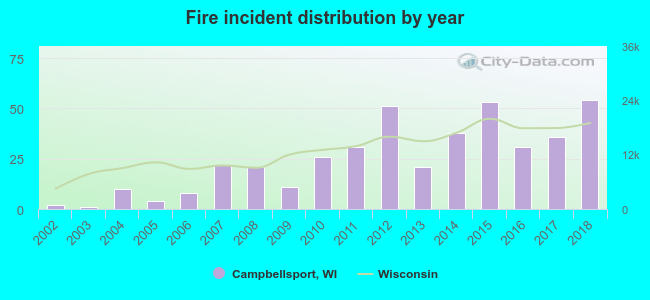 Based on the data from the years 2002 - 2018 the average number of fires per year is 25. The highest number of fires - 54 took place in 2018, and the least - 1 in 2003. The data has a growing trend.
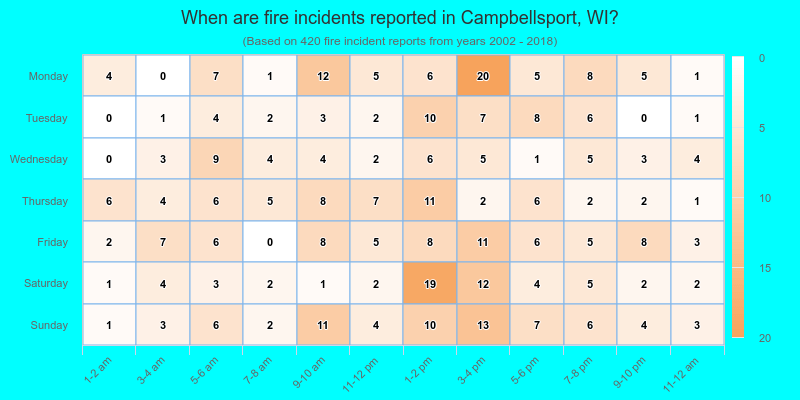
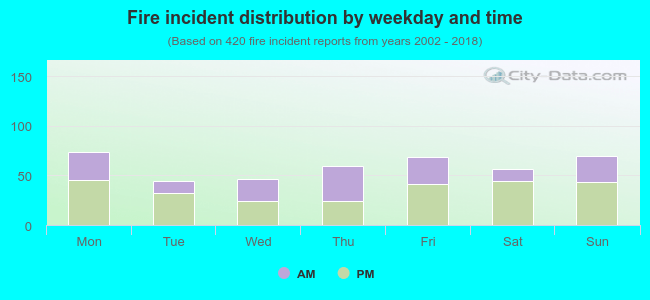 39.8% incidents where reported in the morning and 60.2% in the evening. The most fires (17.6%) took place on Monday, and the least (10.5%) on Tuesday.
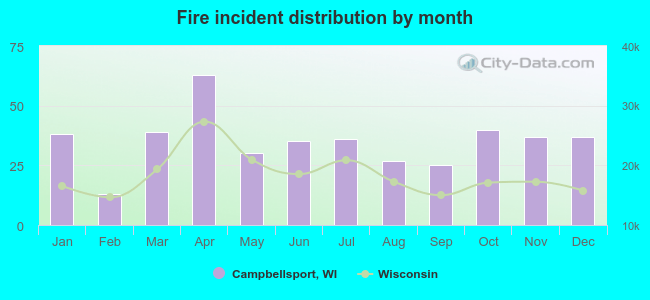 According to the 420 fire incidents from years 2002 - 2018 most fires (15.0%) took place during April, and the least (3.1%) in February.
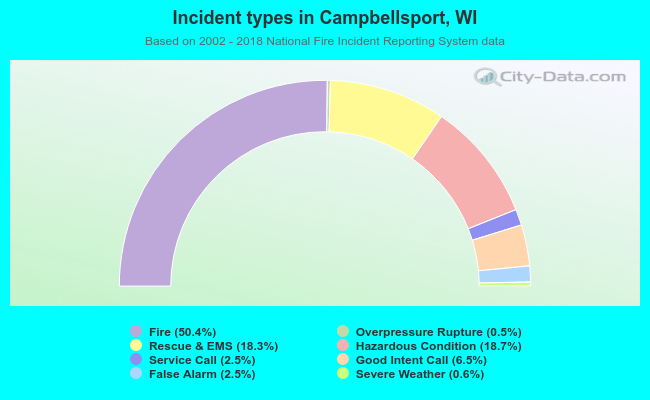 Out of all 834 cases reported during the years 2002 - 2018, the most belonged to the categories: Fire (50.4%), Hazardous Condition (18.7%), and Rescue & EMS (18.3%).
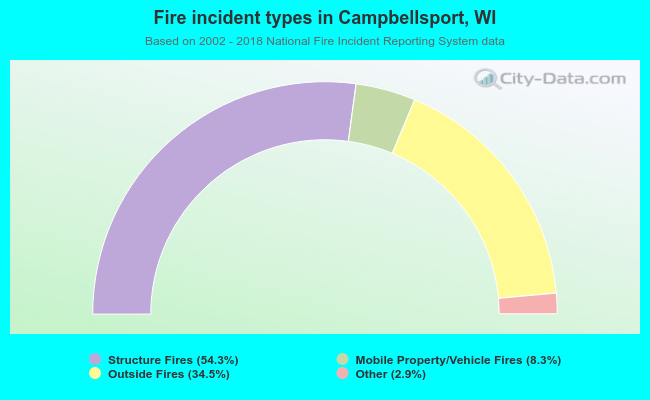 When looking into fire subcategories, the most reports belonged to: Structure Fires (54.3%), and Outside Fires (34.5%).