Cascade: Fire Incidents, Wisconsin (WI)
Where are fire incidents reported in Cascade, WI
Something went wrong! Please refresh the page.
|
| |||||||||||||||||||||||||||||||||||||||||||||||||||||||||||||||||||||||||||||||||||||||||||||||||||||||||||||
2003 - 2018 National Fire Incident Reporting System (NFIRS) incidents
- Incident types reported to NFIRS in Cascade, WI
- 17158.6%Fire
- 6221.2%Rescue & EMS
- 186.2%Good Intent Call
- 144.8%Severe Weather
- 124.1%Hazardous Condition
- 72.4%Service Call
- 41.4%False Alarm
- 41.4%Special Incident
- Fire incident types reported to NFIRS in Cascade, WI
- 13277.2%Structure Fires
- 2313.5%Outside Fires
- 84.7%Mobile Property/Vehicle Fires
- 84.7%Other
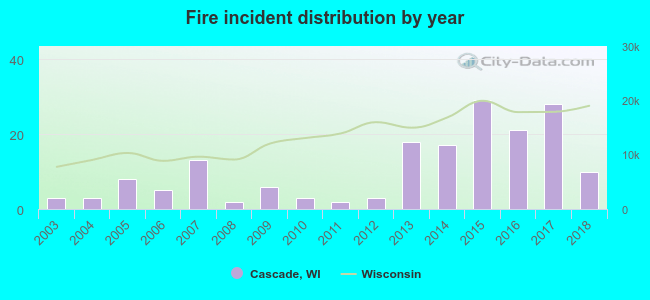 Based on the data from the years 2003 - 2018 the average number of fires per year is 11. The highest number of fires - 29 took place in 2015, and the least - 2 in 2008. The data has a growing trend.
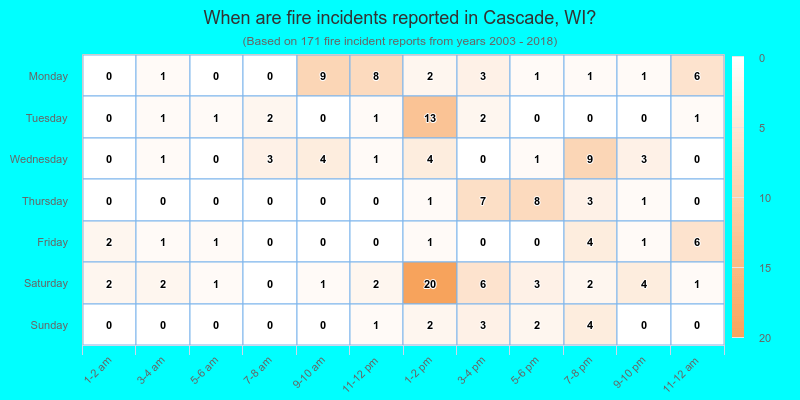
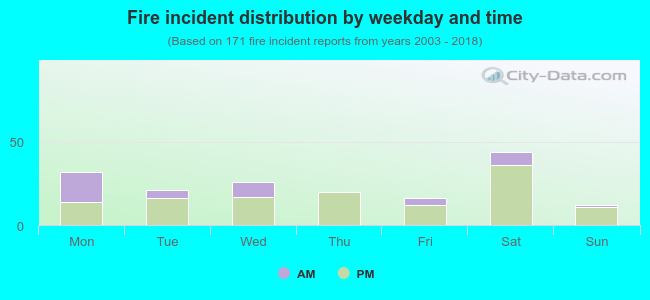 26.3% incidents where reported in the morning and 73.7% in the evening. The most fires (25.7%) took place on Saturday, and the least (7.0%) on Sunday.
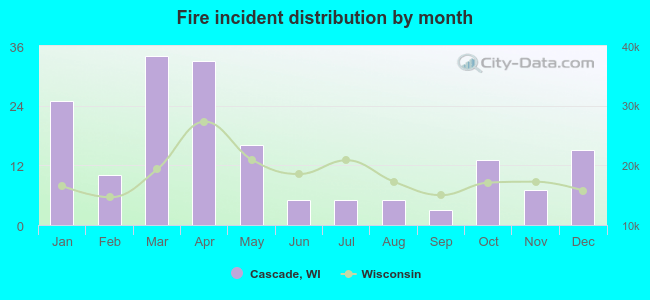 According to the 171 fire incidents from years 2003 - 2018 most fires (19.9%) took place during March, and the least (1.8%) in September.
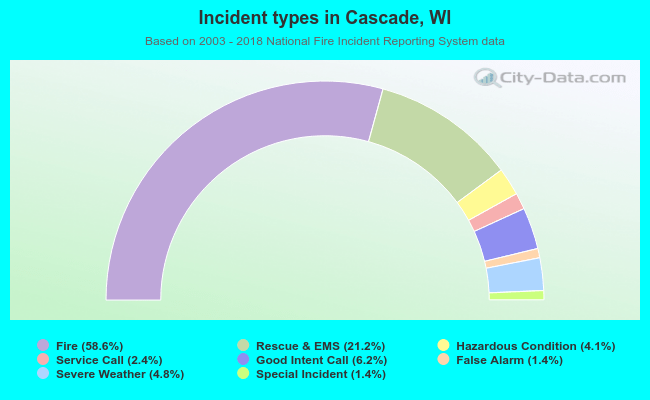 Out of all 292 cases reported during the years 2003 - 2018, the most belonged to the categories: Fire (58.6%), Overpressure Rupture (21.2%), and Service Call (6.2%).
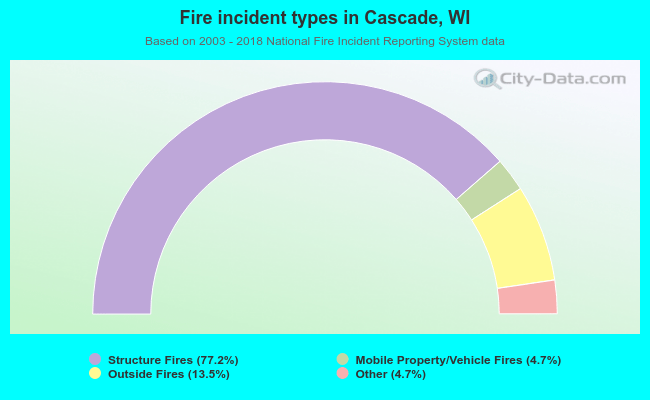 When looking into fire subcategories, the most reports belonged to: Structure Fires (77.2%), and Outside Fires (13.5%).