Caseyville: Fire Incidents, Illinois (IL)
Where are fire incidents reported in Caseyville, IL
Something went wrong! Please refresh the page.
| Fire incidents reported | |
|---|---|
| Sreet name | Count |
| BOTANICAL | 84 |
| HOLLYWOOD HEIGHTS RD | 70 |
| MAIN ST | 64 |
| I-255 | 60 |
| FOREST BLVD | 50 |
| BUNKUM RD | 46 |
| I255 | 38 |
| PARKDALE | 36 |
| I-64 | 34 |
| 81ST ST | 32 |
| BLACKLANE | 32 |
| HILL RD | 32 |
| 89TH ST | 30 |
| LEVEL | 30 |
| STERLING | 30 |
| OLD COUNTRY INN DR | 28 |
| BLACK LN. | 26 |
| TRIONE DR | 24 |
| MORRISON | 22 |
| OLD CASEYVILLE RD | 22 |
| 7TH ST | 20 |
| BERMUDA | 20 |
| BLACK LANE | 20 |
| CLINTON | 20 |
| GARDEN AVE | 20 |
| ACORDI DR | 18 |
| BROOKSIDE DR | 18 |
| RAUCKMAN DR | 18 |
| BETHEL RD | 16 |
| BLACK LANE | 16 |
| Other | 381 |
2002 - 2018 National Fire Incident Reporting System (NFIRS) incidents
- Incident types reported to NFIRS in Caseyville, IL
- 1,59733.0%Rescue & EMS
- 1,35728.1%Fire
- 75915.7%Hazardous Condition
- 4379.0%Good Intent Call
- 3898.0%False Alarm
- 2785.8%Service Call
- 90.2%Severe Weather
- 60.1%Overpressure Rupture
- Fire incident types reported to NFIRS in Caseyville, IL
- 62846.3%Structure Fires
- 46934.6%Outside Fires
- 21916.1%Mobile Property/Vehicle Fires
- 413.0%Other
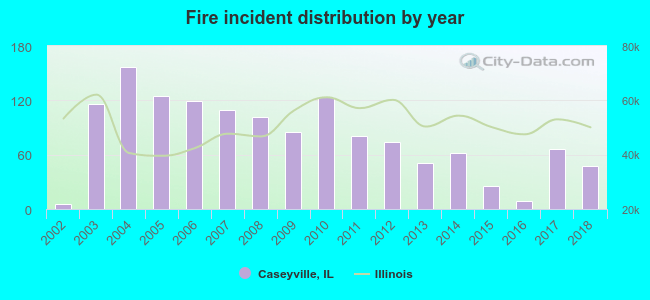 Based on the data from the years 2002 - 2018 the average number of fire incidents per year is 80. The highest number of fire incidents - 157 took place in 2004, and the least - 5 in 2002. The data has a growing trend.
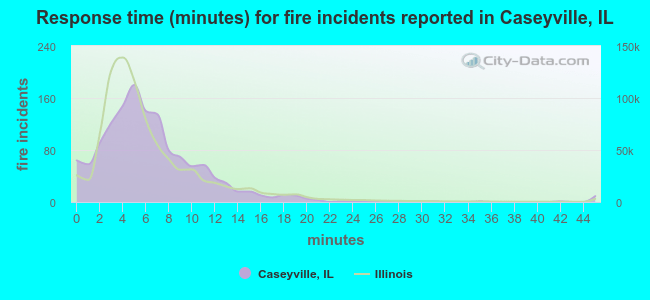 The median response time based on all reported fire incidents is 6 minutes. This is about the same as the Illinois median value.
The median response time in Caseyville, IL compared to nearest cities:
(Note: Based on data for all years, including only cities with at least 500 fire incidents)
| Caseyville: | 6 minutes |
| Fairview Heights: | 5 minutes |
| Washington Park: | 5 minutes |
| Collinsville: | 5 minutes |
| Centreville: | 7 minutes |
| East St. Louis: | 6 minutes |
| Alorton: | 5 minutes |
| Pontoon Beach: | 7 minutes |
| Swansea: | 5 minutes |
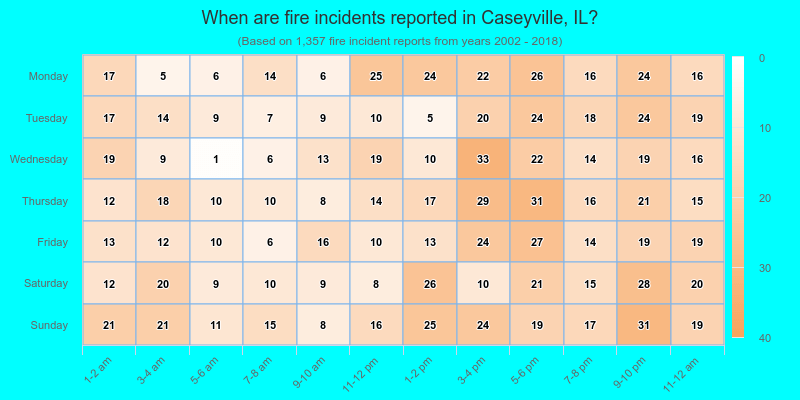
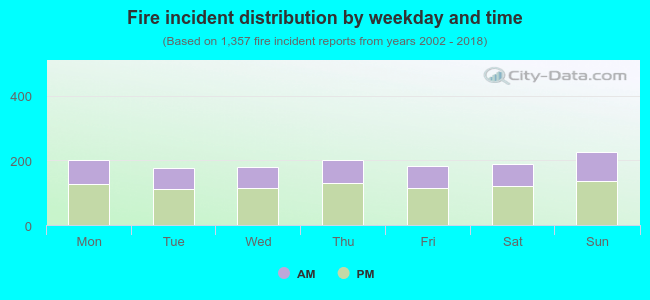 37.2% incidents where reported in the morning and 62.8% in the evening. The most fires (16.7%) took place on Sunday, and the least (13.0%) on Tuesday.
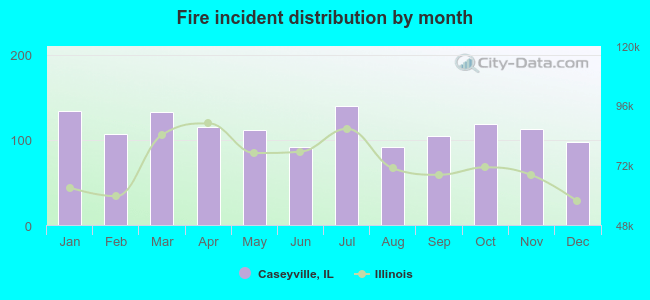 According to the 1,357 fires from years 2002 - 2018 most fires (10.3%) took place during July, and the least (6.7%) in June.
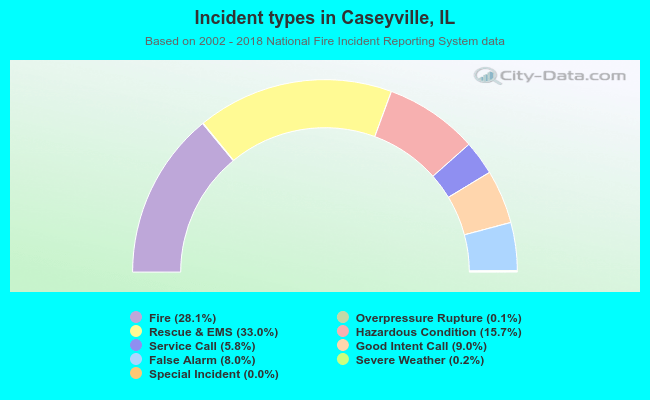 Out of all 4,834 cases reported during the years 2002 - 2018, the most belonged to the categories: Rescue & EMS (33.0%), Fire (28.1%), and Hazardous Condition (15.7%).
 When looking into fire subcategories, the most incidents belonged to: Structure Fires (46.3%), and Outside Fires (34.6%).