Cedar Lake: Fire Incidents, Indiana (IN)
Where are fire incidents reported in Cedar Lake, IN
Something went wrong! Please refresh the page.
|
| |||||||||||||||||||||||||||||||||||||||||||||||||||||||||||||||||||||||||||||||||||||||||||||||||||||||||||||
2003 - 2017 National Fire Incident Reporting System (NFIRS) incidents
- Incident types reported to NFIRS in Cedar Lake, IN
- 74545.4%Hazardous Condition
- 68641.8%Fire
- 1096.6%Service Call
- 503.0%Rescue & EMS
- 332.0%Good Intent Call
- 161.0%False Alarm
- Fire incident types reported to NFIRS in Cedar Lake, IN
- 30744.8%Structure Fires
- 26638.8%Outside Fires
- 578.3%Mobile Property/Vehicle Fires
- 568.2%Other
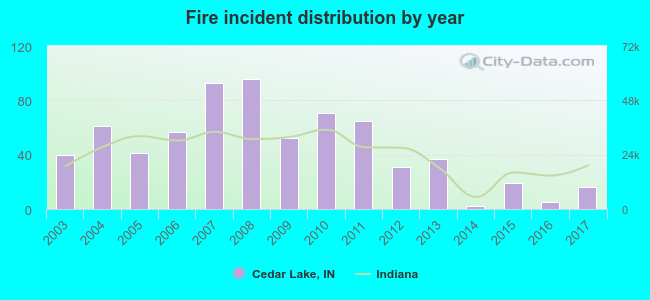 According to the data from the years 2003 - 2017 the average number of fire incidents per year is 46. The highest number of reported fires - 96 took place in 2008, and the least - 2 in 2014. The data has a dropping trend.
The average number of yearly fire incidents per 10k residents in Cedar Lake, IN compared to nearest cities:
(Note: Based on data for the last 3 years, including only cities with population 5,000 and above)
| Cedar Lake: | 8.9 |
| Lowell: | 36.2 |
| Crown Point: | 18.9 |
| Schererville: | 13.3 |
| Merrillville: | 23.5 |
| Dyer: | 18.9 |
| Griffith: | 3.6 |
| Highland: | 16.3 |
| Munster: | 15.9 |
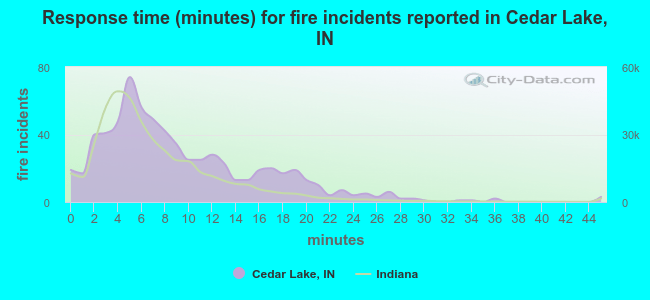 The median response time based on all reported fire incidents is 7 minutes. This is comparable to the state median value.
The median response time in Cedar Lake, IN compared to nearest cities:
(Note: Based on data for all years, including only cities with at least 500 fire incidents)
| Cedar Lake: | 7 minutes |
| Lowell: | 9 minutes |
| Crown Point: | 6 minutes |
| Schererville: | 7 minutes |
| Merrillville: | 5 minutes |
| Beecher: | 8 minutes |
| Dyer: | 7 minutes |
| Sauk Village: | 8 minutes |
| Crete: | 6 minutes |
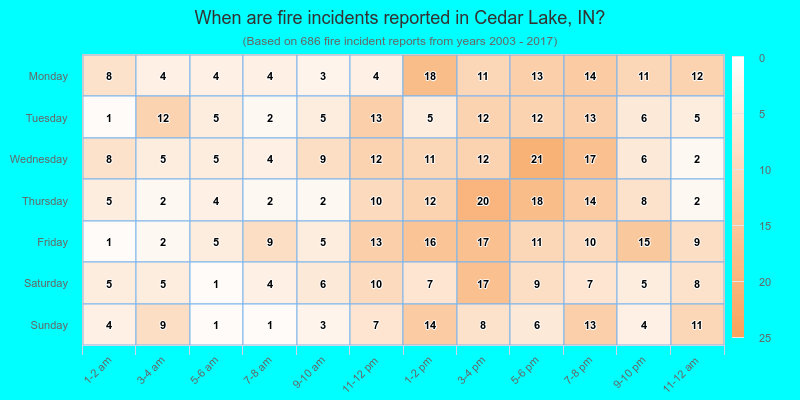
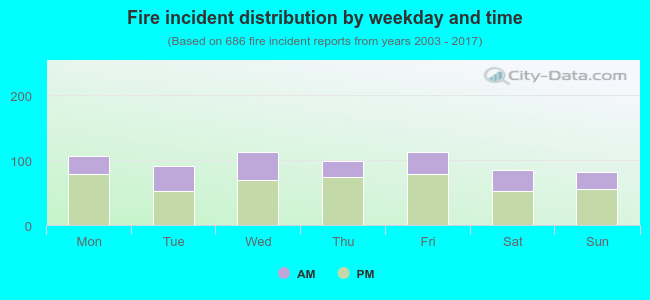 32.7% incidents where reported in the morning and 67.3% in the evening. The most fires (16.5%) took place on Friday, and the least (11.8%) on Sunday.
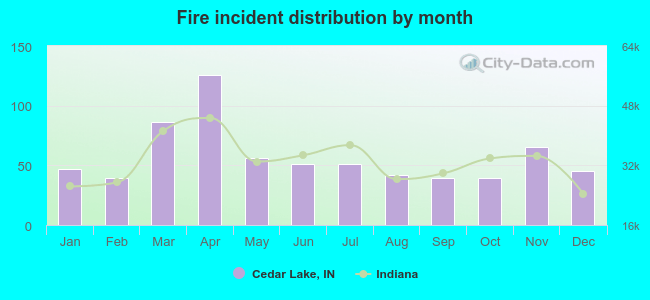 Based on the 686 incident reports from years 2003 - 2017 most fires (18.4%) took place during April, and the least (5.7%) in February.
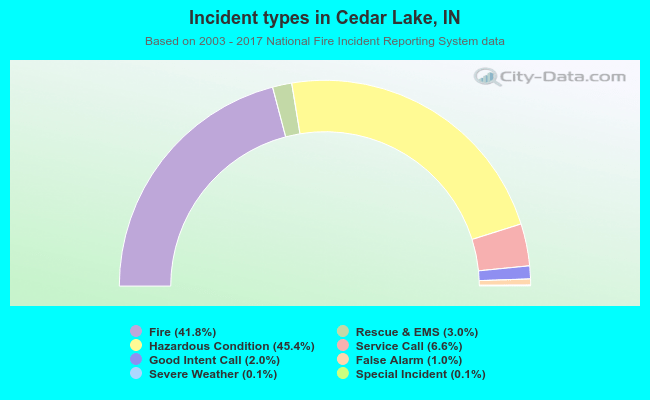 Out of all 1,641 cases reported during the years 2003 - 2017, the most belonged to the categories: Rescue & EMS (45.4%), Fire (41.8%), and Hazardous Condition (6.6%).
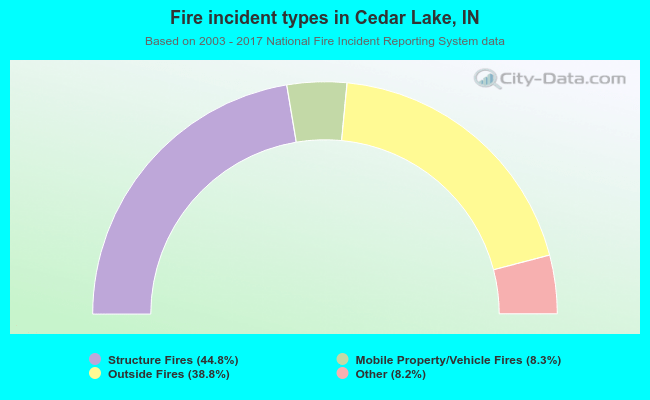 When looking into fire subcategories, the most incidents belonged to: Structure Fires (44.8%), and Outside Fires (38.8%).