Cheyenne: Fire Incidents, Wyoming (WY)
Where are fire incidents reported in Cheyenne, WY
Something went wrong! Please refresh the page.
| Fire incidents reported | |
|---|---|
| Sreet name | Count |
| LINCOLNWAY | 226 |
| GREELEY HWY | 206 |
| I 25 | 128 |
| OTTO RD | 106 |
| COLLEGE DR | 102 |
| PERSHING BLVD | 90 |
| ALLISON RD | 82 |
| DELL RANGE BLVD | 82 |
| I 80 | 72 |
| I80 | 68 |
| CAMPSTOOL RD | 64 |
| I25 | 58 |
| HAPPY JACK RD | 54 |
| WILLIAMS ST | 54 |
| 17TH ST | 52 |
| RIDGE RD | 52 |
| JEFFERSON RD | 48 |
| 12TH ST | 46 |
| 5TH ST | 40 |
| FOX FARM RD | 40 |
| I-80 | 40 |
| 18TH ST | 38 |
| CENTRAL AVE | 38 |
| TAFT AVE | 36 |
| YELLOWSTONE RD | 36 |
| 19TH ST | 34 |
| 7TH ST | 34 |
| INTERSTATE 80 | 34 |
| PROSSER RD | 34 |
| 20TH ST | 32 |
| Other | 1,784 |
2002 - 2018 National Fire Incident Reporting System (NFIRS) incidents
- Incident types reported to NFIRS in Cheyenne, WY
- 21,54060.0%Rescue & EMS
- 3,81010.6%Fire
- 3,79010.6%Hazardous Condition
- 2,4056.7%False Alarm
- 2,3446.5%Good Intent Call
- 1,8375.1%Service Call
- 870.2%Special Incident
- 470.1%Overpressure Rupture
- Fire incident types reported to NFIRS in Cheyenne, WY
- 1,62542.7%Outside Fires
- 1,20231.5%Structure Fires
- 63316.6%Mobile Property/Vehicle Fires
- 3509.2%Other
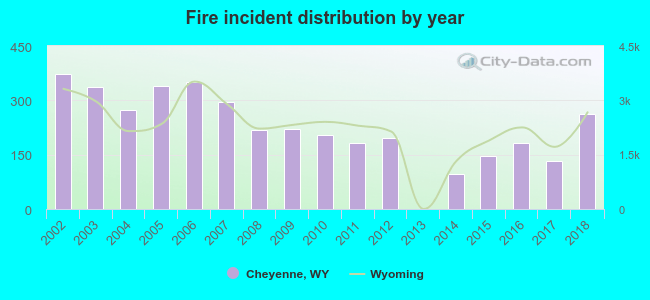 According to the data from the years 2002 - 2018 the average number of fires per year is 224. The highest number of reported fire incidents - 374 took place in 2002, and the least - 0 in 2013. The data has a dropping trend.
The average number of yearly fire incidents per 10k residents in Cheyenne, WY compared to nearest cities:
(Note: Based on data for the last 3 years, including only cities with population 5,000 and above)
| Cheyenne: | 30.7 |
| Laramie: | 16.8 |
| Torrington: | 58.9 |
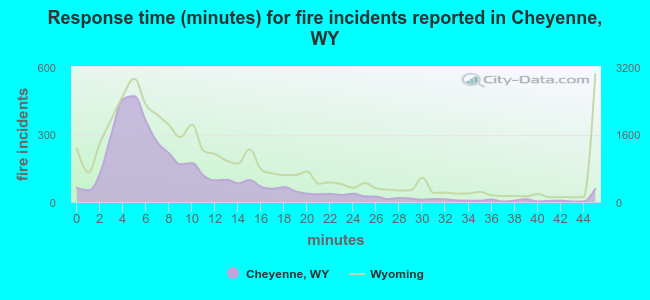 The median response time based on all reported fire incidents is 7 minutes. This is lower compared to the state median value.
The median response time in Cheyenne, WY compared to nearest cities:
(Note: Based on data for all years, including only cities with at least 500 fire incidents)
| Cheyenne: | 7 minutes |
| Wellington: | 11 minutes |
| Laramie: | 10 minutes |
| Eaton: | 8 minutes |
| Fort Collins: | 6 minutes |
| Windsor: | 7 minutes |
| Greeley: | 7 minutes |
| Evans: | 6 minutes |
| Loveland: | 6 minutes |
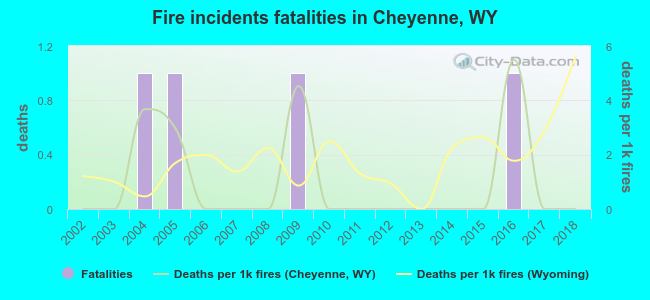 Based on the data from the years 2002 - 2018 the average number of fire-related yearly deaths is 0. The highest number of reported deaths - 1 took place in 2004, and the lowest - 0 in 2002. The data has a constant trend.
The average number of deaths per 1,000 fires is 1. This indicator was the highest - 5 in 2016, and the lowest 0 in 2002. The trend for fatalities per 1,000 incidents is constant. Compared to the Wyoming value the number of fatalities per 1,000 incidents is lower.
Based on the data from the years 2002 - 2018 the average number of fire-related yearly deaths is 0. The highest number of reported deaths - 1 took place in 2004, and the lowest - 0 in 2002. The data has a constant trend.
The average number of deaths per 1,000 fires is 1. This indicator was the highest - 5 in 2016, and the lowest 0 in 2002. The trend for fatalities per 1,000 incidents is constant. Compared to the Wyoming value the number of fatalities per 1,000 incidents is lower.Deaths per 1,000 incidents in Cheyenne, WY compared to nearest cities:
(Note: Based on data for all years, including only cities with at least 2,500 fire incidents)
| Cheyenne: | 1.0 |
| Fort Collins: | 1.0 |
| Greeley: | 2.0 |
| Loveland: | 2.9 |
| Longmont: | 0.9 |
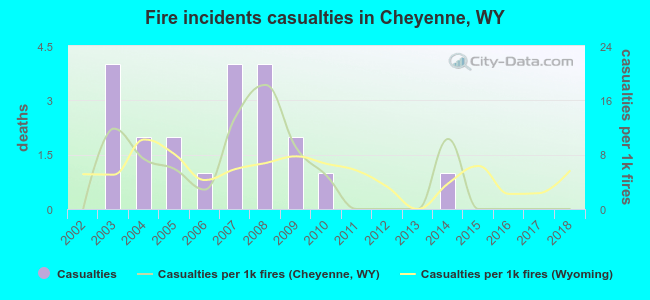 Based on the data from the years 2002 - 2018 the average number of fire-related yearly casualties is 1. The highest number of reported casualties - 4 took place in 2003, and the lowest - 0 in 2002. The data has a constant trend.
The average number of casualties per 1,000 fire incidents is 5. This indicator was the highest - 18 in 2008, and the lowest 0 in 2002. The trend for casualties per 1,000 fires is constant. Compared to the state value the number of casualties per 1,000 fires is about the same.
Based on the data from the years 2002 - 2018 the average number of fire-related yearly casualties is 1. The highest number of reported casualties - 4 took place in 2003, and the lowest - 0 in 2002. The data has a constant trend.
The average number of casualties per 1,000 fire incidents is 5. This indicator was the highest - 18 in 2008, and the lowest 0 in 2002. The trend for casualties per 1,000 fires is constant. Compared to the state value the number of casualties per 1,000 fires is about the same.Casualties per 1,000 incidents in Cheyenne, WY compared to nearest cities:
(Note: Based on data for all years, including only cities with at least 500 fire incidents)
| Cheyenne: | 5.5 |
| Wellington: | 8.2 |
| Laramie: | 7.7 |
| Eaton: | 11.3 |
| Fort Collins: | 25.2 |
| Windsor: | 1.3 |
| Greeley: | 11.3 |
| Evans: | 5.9 |
| Loveland: | 13.7 |
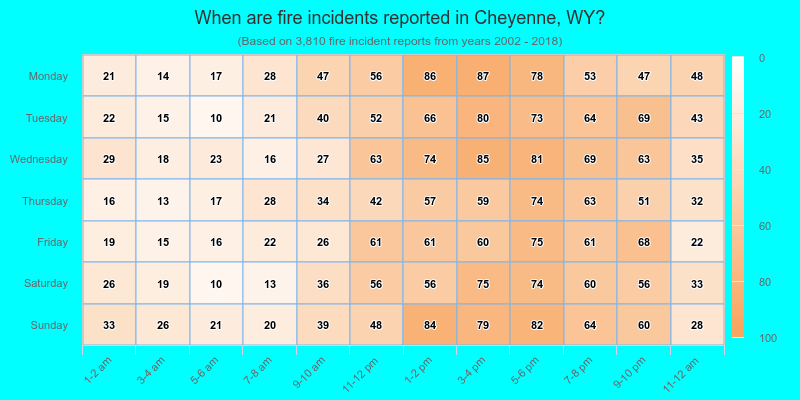
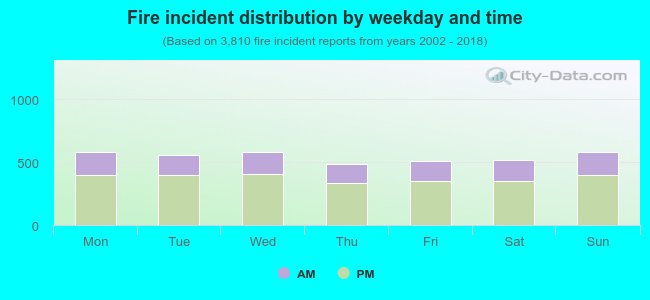 30.8% incidents where reported in the morning and 69.2% in the evening. The most fires (15.3%) took place on Sunday, and the least (12.8%) on Thursday.
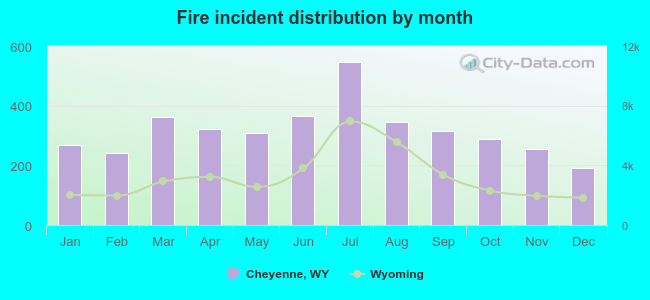 According to the 3,810 incident reports from years 2002 - 2018 most fires (14.4%) took place during July, and the least (5.0%) in December.
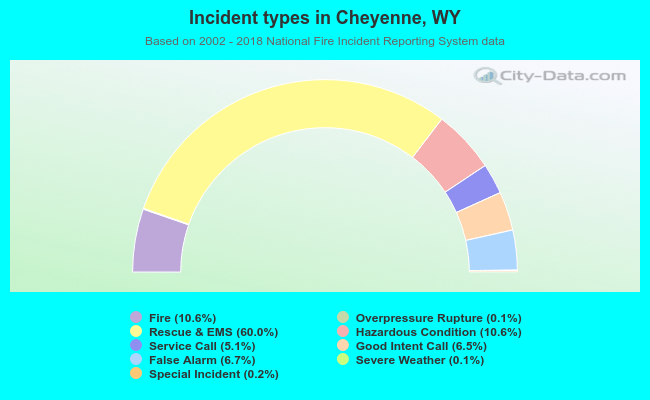 Out of all 35,880 cases reported during the years 2002 - 2018, the most belonged to the categories: Rescue & EMS (60.0%), Fire (10.6%), and Hazardous Condition (10.6%).
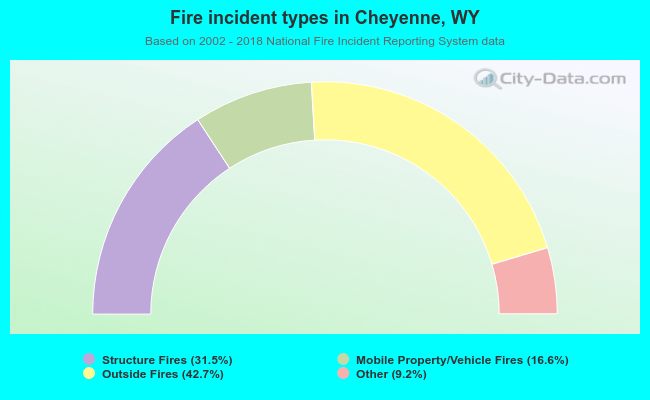 When looking into fire subcategories, the most incidents belonged to: Outside Fires (42.7%), and Structure Fires (31.5%).