| Fire incidents reported |
|---|
| Sreet name | Count |
|---|
| I-25 HWY | 52 | | SLATER RD. HWY | 14 | | INTERSTATE 25 | 10 | | HIGHWAY 313 HWY | 8 | | I 25 | 8 | | IRON MOUNTAIN RD. | 8 | | ROAD 237 | 8 | | 4TH STREET | 6 | | INTERSTATE 25 HWY | 6 | | PLEASENT VALLEY ROAD | 6 | | BEAR CREEK RD. | 4 | | BLUEROCK RD. | 4 | | CHUGWATER | 4 | | FIFTH ST. | 4 | | GOSHEN COUNTY | 4 | | LARAMIE CO. RD. 237 | 4 | | LONE TREE ROAD | 4 | | SWAN AVE. | 4 | | THIRD ST. | 4 | | 3RD ST | 2 | | 6TH STREET | 2 | | 7TH ST. | 2 | | ANTELOPE GAP ROAD | 2 | | BLUFFS RD. | 2 | | BORDEAUX RD. | 2 |
| | | Fire incidents reported |
|---|
| Sreet name | Count |
|---|
| BOWIE ST | 2 | | BRITTANY ROAD | 2 | | BUFFALO DRIVE | 2 | | BURLINGTON NORTHERN RIGHT | 2 | | CHALK BLUFFS RD. | 2 | | DIAMOND ROAD | 2 | | GOSHEN COUNTY ROAD 16 | 2 | | GOSHEN COUNTY ROAD 24 | 2 | | HAPPY HOLLOW RD | 2 | | HAVELY RD | 2 | | HAVELY RD. | 2 | | HIGHWAY 313 | 2 | | HIGHWAY 34 | 2 | | I 25 MILE POST55 | 2 | | I 25 SERVICE ROAD | 2 | | I-25 | 2 | | I25 HWY | 2 | | INTERSTSTE 25 | 2 | | IRON MOUNTAIN RD | 2 | | IRON MOUNTAIN RD | 2 | | KELLY AVE | 2 | | KELLY AVE. | 2 | | KELLY ST | 2 | | LARAMIE CO RD. 238 | 2 | | |
|
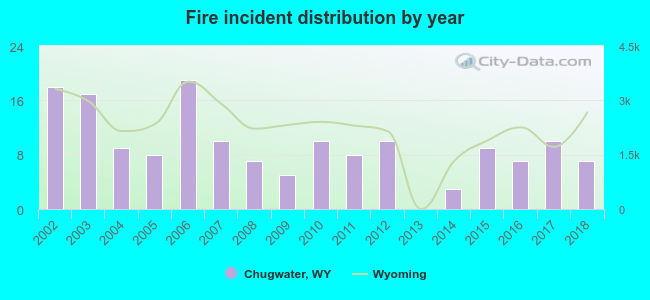 According to the data from the years 2002 - 2018 the average number of fires per year is 9. The highest number of reported fire incidents - 19 took place in 2006, and the least - 0 in 2013. The data has a dropping trend.
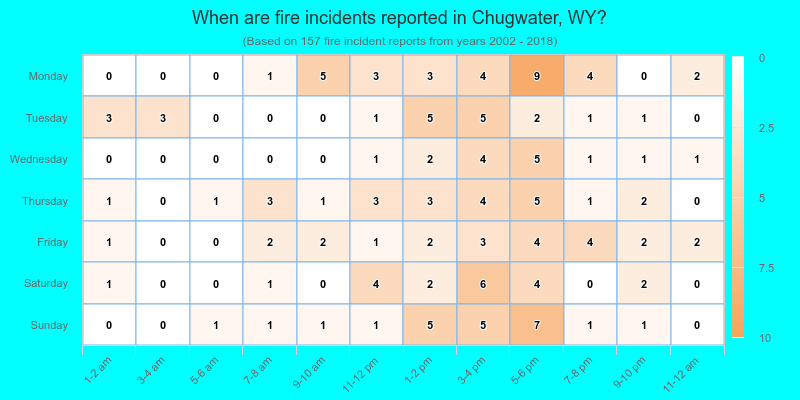
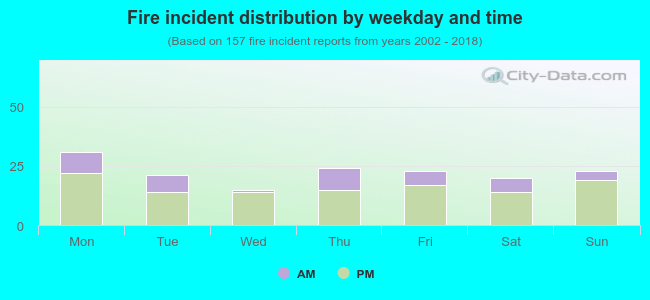 26.8% incidents where reported in the morning and 73.2% in the evening. The most fires (19.7%) took place on Monday, and the least (9.6%) on Wednesday.
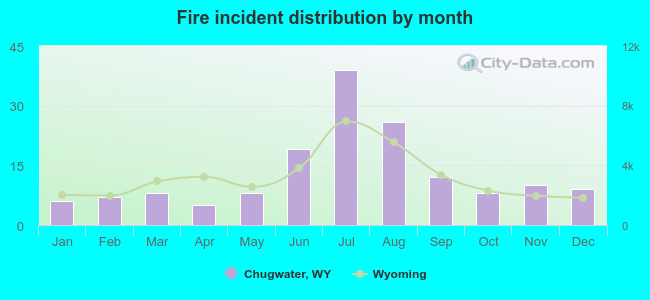 Based on the 157 fire incidents from years 2002 - 2018 most fires (24.8%) took place during July, and the least (3.2%) in April.
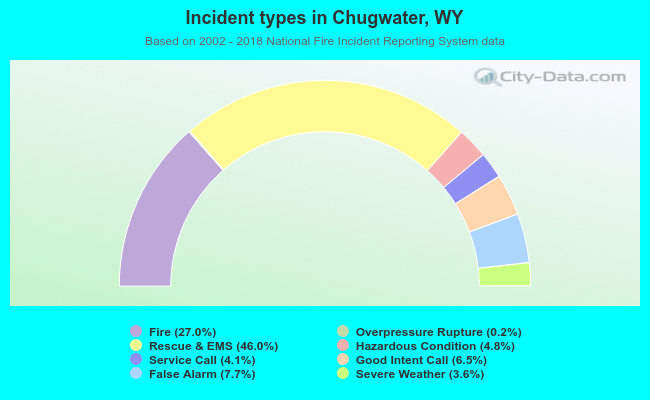 Out of all 581 cases reported during the years 2002 - 2018, the most belonged to the categories: Rescue & EMS (46.0%), Fire (27.0%), and False Alarm (7.7%).
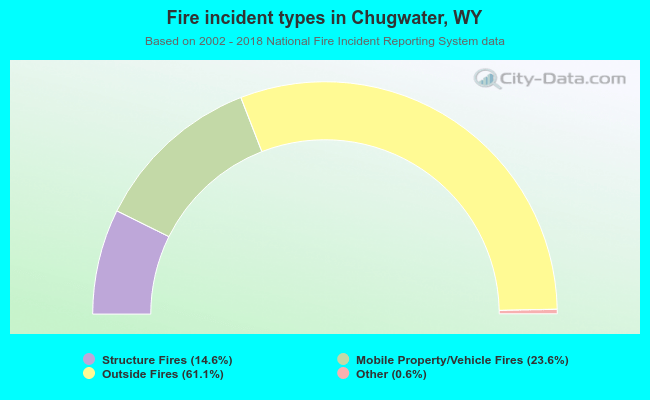 When looking into fire subcategories, the most incidents belonged to: Outside Fires (61.1%), and Mobile Property/Vehicle Fires (23.6%).