Cicero: Fire Incidents, Indiana (IN)
Where are fire incidents reported in Cicero, IN
Something went wrong! Please refresh the page.
|
| |||||||||||||||||||||||||||||||||||||||||||||||||||||||||||||||||||||||||||||||||||||||||||||||||||||||||||||
2002 - 2018 National Fire Incident Reporting System (NFIRS) incidents
- Incident types reported to NFIRS in Cicero, IN
- 94142.1%Rescue & EMS
- 44720.0%Fire
- 28912.9%Hazardous Condition
- 26912.0%Good Intent Call
- 2139.5%Service Call
- 612.7%False Alarm
- 70.3%Special Incident
- 50.2%Severe Weather
- Fire incident types reported to NFIRS in Cicero, IN
- 17639.4%Outside Fires
- 15735.1%Structure Fires
- 7015.7%Other
- 449.8%Mobile Property/Vehicle Fires
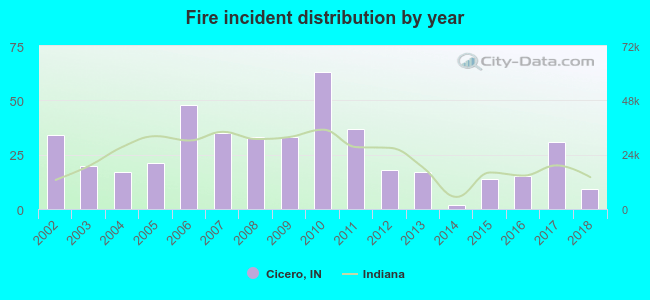 Based on the data from the years 2002 - 2018 the average number of fire incidents per year is 26. The highest number of reported fires - 63 took place in 2010, and the least - 2 in 2014. The data has a declining trend.
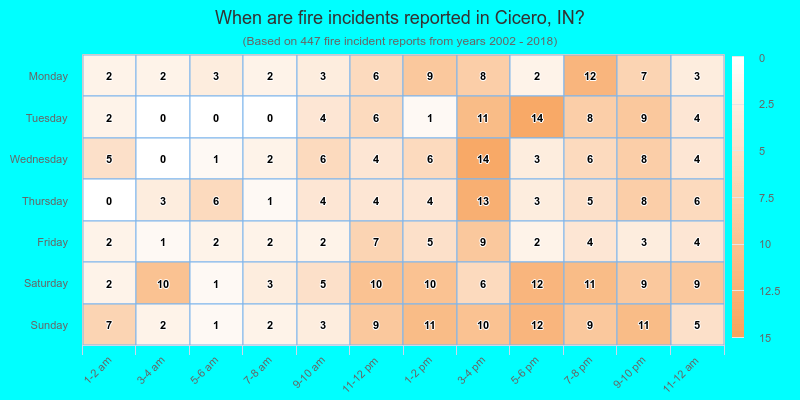
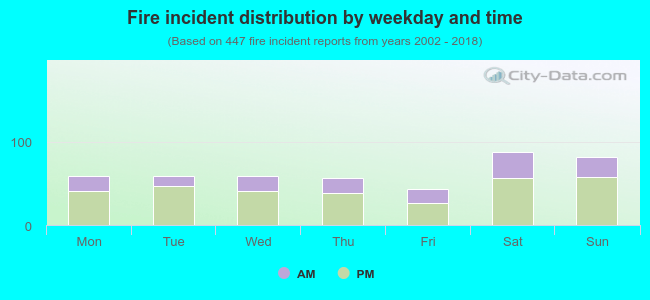 30.6% incidents where reported in the morning and 69.4% in the evening. The most fires (19.7%) took place on Saturday, and the least (9.6%) on Friday.
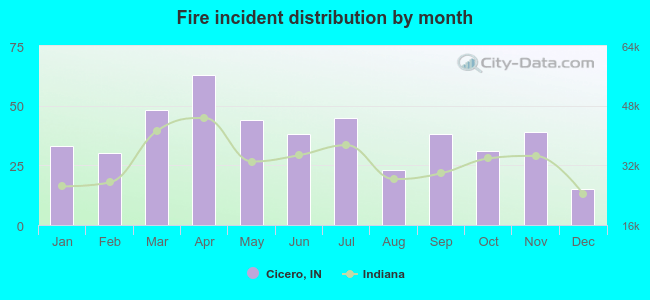 According to the 447 reports from years 2002 - 2018 most fires (14.1%) took place during April, and the least (3.4%) in December.
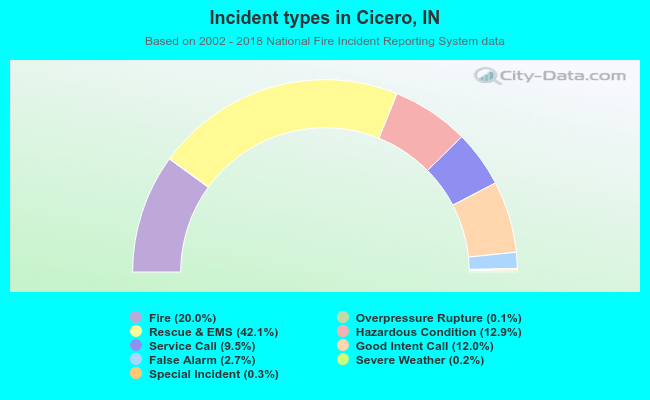 Out of all 2,234 cases reported during the years 2002 - 2018, the most belonged to the categories: Rescue & EMS (42.1%), Fire (20.0%), and Hazardous Condition (12.9%).
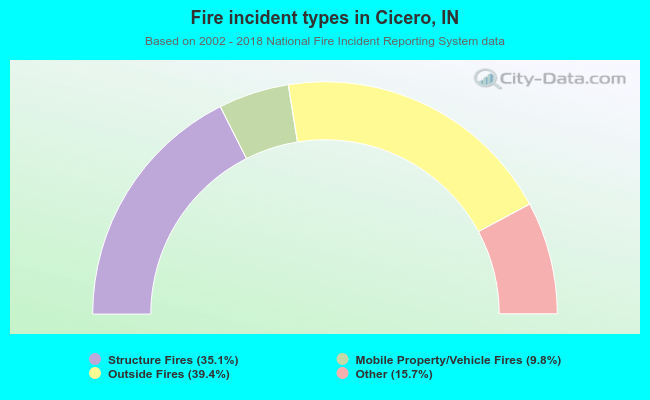 When looking into fire subcategories, the most incidents belonged to: Outside Fires (39.4%), and Structure Fires (35.1%).