| Fire incidents reported |
|---|
| Sreet name | Count |
|---|
| CINCINNATUS MUTUAL AID | 28 | | CINCINNATUS RD | 16 | | LOWER CINCINNATUS RD | 16 | | TELEPHONE RD | 16 | | TELEPHONE RD | 16 | | CHENINGO SOLON POND RD | 14 | | CINCINNATUS RD | 12 | | COUNTY ROUTE 2 CR | 12 | | ROUTE 41 | 12 | | RT 41 | 12 | | DORAN HILL RD | 10 | | ELWOOD RD | 10 | | ELWOOD RD | 10 | | FACTORY DRIVE | 8 | | MARICLE RD | 8 | | ROUTE 23 PIT SR | 8 | | ROUTE 26 - COR SR | 8 | | TELEPHONE RD EXT | 8 | | CARR ROAD | 6 | | CHING SOL.ON POND | 6 | | LOWER CINCY/WILLET RD | 6 | | MAY ROAD | 6 | | N PUCKER ST | 6 | | PIETY HILL | 6 | | PITCHER HILL RDS | 6 |
| | | Fire incidents reported |
|---|
| Sreet name | Count |
|---|
| PRESTON ROAD | 6 | | ROUTE 41 CIN SR | 6 | | ROUTE 41 WIL | 6 | | STONE RD | 6 | | TELEPHONE CIN RD | 6 | | TELEPHONE RD EXT | 6 | | UNION VALLEY RD | 6 | | BAKER SCHOOLHOUSE RD | 4 | | BROOKS HILL RD | 4 | | CLARK RD | 4 | | COUNTY ROUTE 5 CR | 4 | | DEERPATH LN | 4 | | DUTCH HILL SPUR RD | 4 | | ELWOOD RD. | 4 | | GEE BROOK RD | 4 | | GEE BROOK RD | 4 | | HAKES CALHOUN DAVIS RD | 4 | | HARRIS RD | 4 | | HOLLOW RD | 4 | | LANDERS CORNERS RD | 4 | | N TOWER RD | 4 | | PUCKER ST | 4 | | ROUTE 26 | 4 | | ROUTE 26 - CORT SR | 4 | | |
|
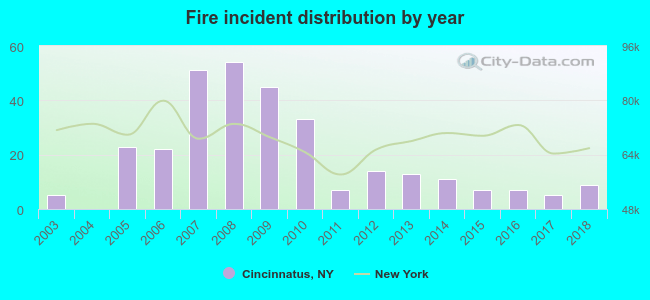 Based on the data from the years 2003 - 2018 the average number of fires per year is 19. The highest number of reported fires - 54 took place in 2008, and the least - 0 in 2004. The data has a rising trend.
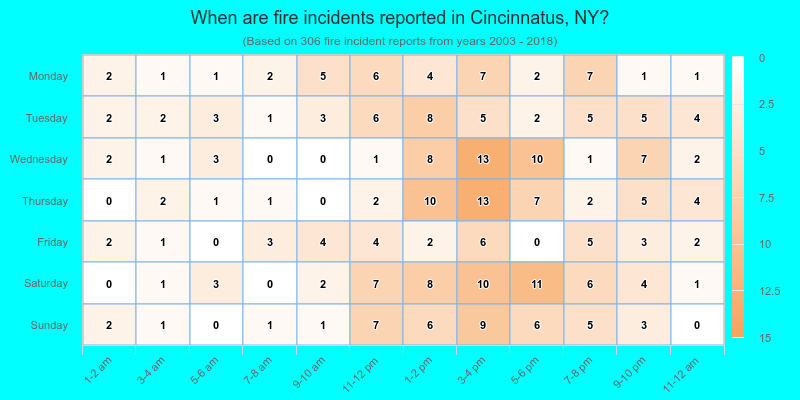
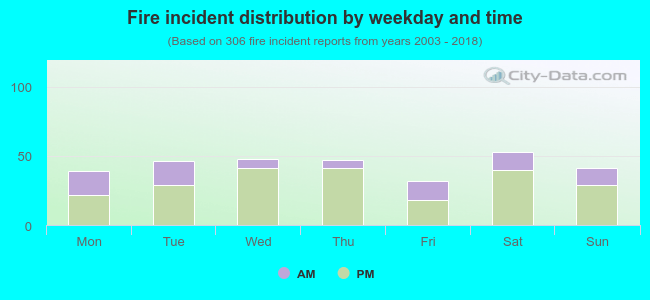 28.1% incidents where reported in the morning and 71.9% in the evening. The most fires (17.3%) took place on Saturday, and the least (10.5%) on Friday.
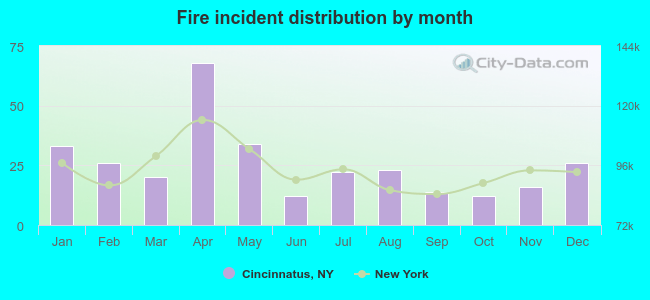 According to the 306 fire incident reports from years 2003 - 2018 most fires (22.2%) took place during April, and the least (3.9%) in June.
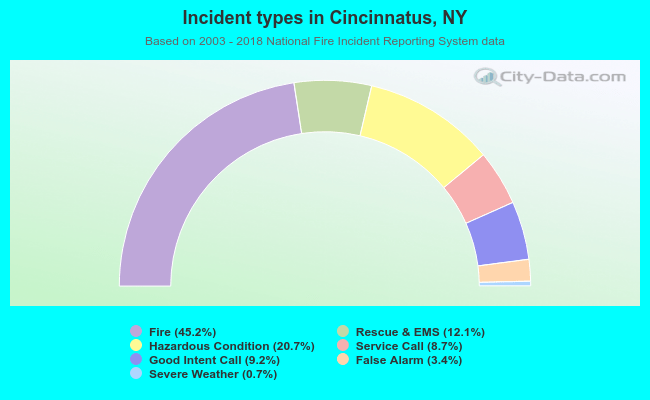 Out of all 677 cases reported during the years 2003 - 2018, the most belonged to the categories: Fire (45.2%), Rescue & EMS (20.7%), and Overpressure Rupture (12.1%).
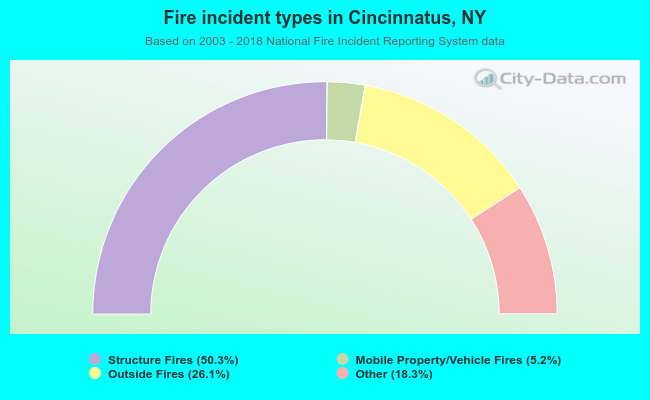 When looking into fire subcategories, the most incidents belonged to: Structure Fires (50.3%), and Outside Fires (26.1%).