| Fire incidents reported |
|---|
| Sreet name | Count |
|---|
| HOLLEY BYRON RD | 42 | | EAST LEE RD | 30 | | UPPER HOLLEY RD | 18 | | FOURTH SECTION RD | 14 | | SUNSET DR | 14 | | HALL RD | 12 | | POWERLINE RD | 12 | | FANCHER RD | 10 | | GLIDDEN RD | 10 | | HINDS RD | 8 | | HULBERTON RD | 8 | | CHURCH ST | 6 | | LAKE RD | 6 | | MERRILL RD | 6 | | SOUTH HOLLEY RD | 6 | | SOUTH MANNING RD | 6 | | TRINITY DR | 6 | | BENNETTS CORNER RD | 4 | | ELIZABETH DR | 4 | | FANCHER RD | 4 | | HINDSBURG RD | 4 | | JACKSON RD | 4 | | MANSFIELD RD | 4 |
| | | Fire incidents reported |
|---|
| Sreet name | Count |
|---|
| MUNGER RD | 4 | | BENNETTS CORNERS RD | 2 | | BOOTS | 2 | | BOOTS RD | 2 | | BROWN SCHOOL HOUSE RD | 2 | | BROWNSCHOOL HOUSE RD | 2 | | CHURCHCLARENDON ST | 2 | | EAST LEE RD | 2 | | ERIE ST | 2 | | HOLLEY BYRON RD | 2 | | HOLLEY RD | 2 | | JACKSON ROAD | 2 | | LADUE RD | 2 | | MILL ST | 2 | | MONROE-ORLEANS COUNTY L RD | 2 | | MORGAN RD | 2 | | MUNGER RD | 2 | | PEBBLE DR | 2 | | PUMPING STATION RD | 2 | | RT. 31A | 2 | | SUNSET DR - THOMAS ESTATE | 2 | | TAYLOR RD | 2 | | WEST LEE RD | 2 |
|
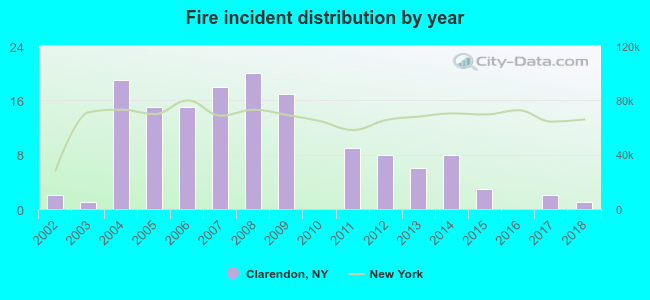 Based on the data from the years 2002 - 2018 the average number of fire incidents per year is 8. The highest number of reported fire incidents - 20 took place in 2008, and the least - 0 in 2010. The data has a dropping trend.
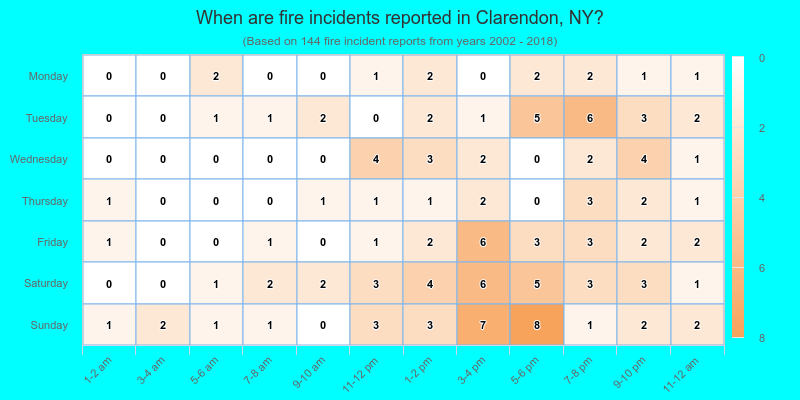
 22.9% incidents where reported in the morning and 77.1% in the evening. The most fires (21.5%) took place on Sunday, and the least (7.6%) on Monday.
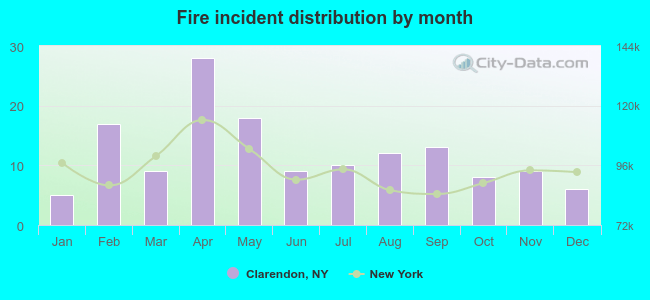 According to the 144 reports from years 2002 - 2018 most fires (19.4%) took place during April, and the least (3.5%) in January.
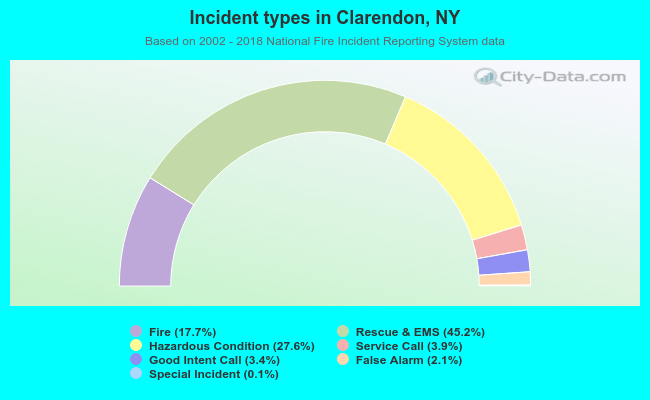 Out of all 815 cases reported during the years 2002 - 2018, the most belonged to the categories: Overpressure Rupture (45.2%), Rescue & EMS (27.6%), and Fire (17.7%).
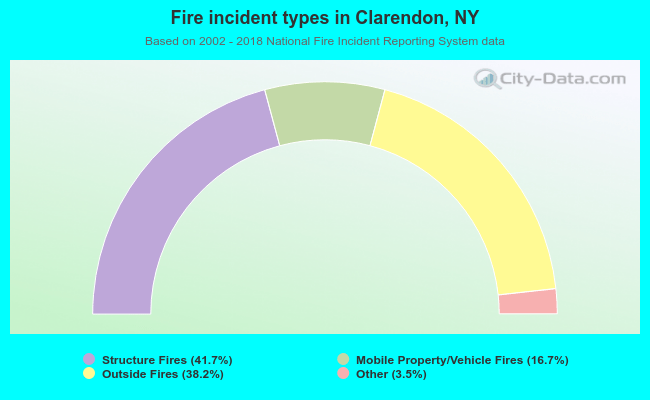 When looking into fire subcategories, the most incidents belonged to: Structure Fires (41.7%), and Outside Fires (38.2%).