Clarissa: Fire Incidents, Minnesota (MN)
Where are fire incidents reported in Clarissa, MN
Something went wrong! Please refresh the page.
|
| |||||||||||||||||||||||||||||||||||||||||||||||||||||||||||||||||||||||||||||||||||||||||||||||||||||||||||||
2005 - 2018 National Fire Incident Reporting System (NFIRS) incidents
- Incident types reported to NFIRS in Clarissa, MN
- 22355.5%Rescue & EMS
- 14034.8%Fire
- 153.7%Hazardous Condition
- 143.5%Good Intent Call
- 61.5%False Alarm
- 30.7%Severe Weather
- 10.2%Service Call
- Fire incident types reported to NFIRS in Clarissa, MN
- 6949.3%Structure Fires
- 3827.1%Outside Fires
- 1712.1%Other
- 1611.4%Mobile Property/Vehicle Fires
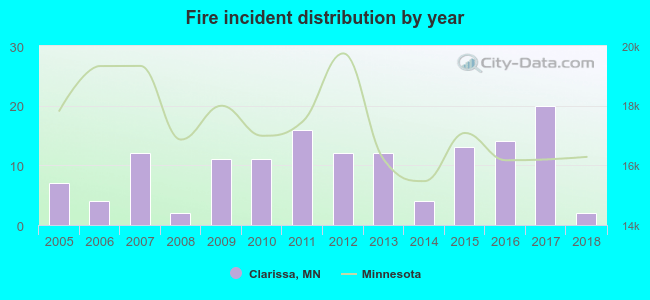 Based on the data from the years 2005 - 2018 the average number of fire incidents per year is 10. The highest number of fires - 20 took place in 2017, and the least - 2 in 2008. The data has a dropping trend.
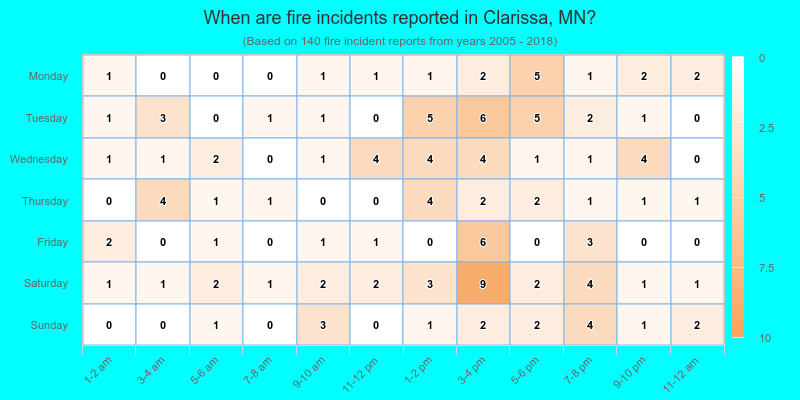
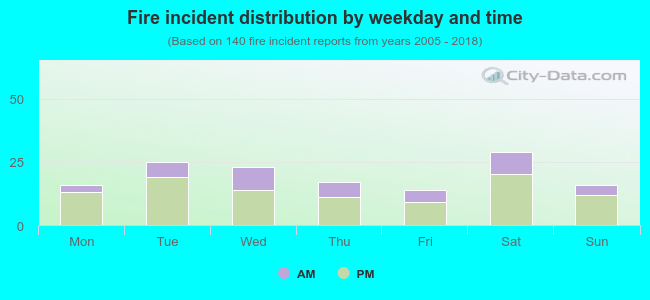 30.0% incidents where reported in the morning and 70.0% in the evening. The most fires (20.7%) took place on Saturday, and the least (10.0%) on Friday.
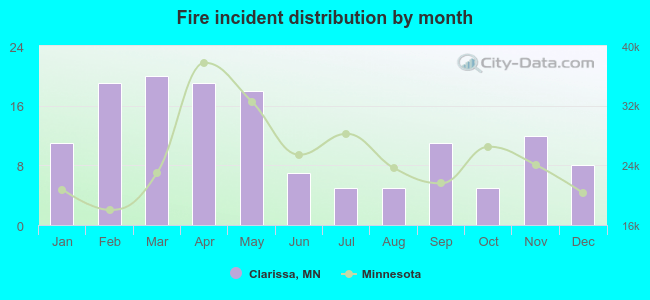 According to the 140 fire incident reports from years 2005 - 2018 most fires (14.3%) took place during March, and the least (3.6%) in July.
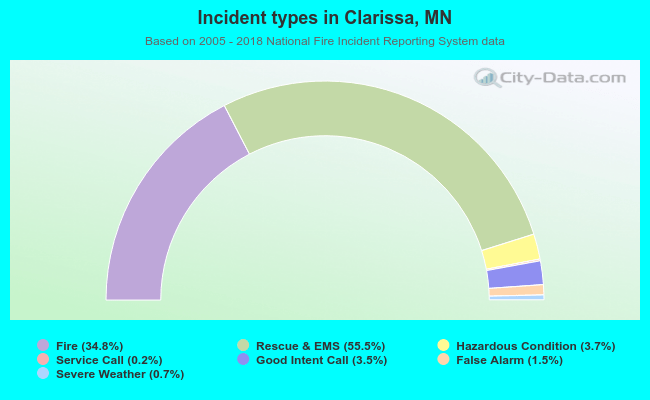 Out of all 402 cases reported during the years 2005 - 2018, the most belonged to the categories: Overpressure Rupture (55.5%), Fire (34.8%), and Rescue & EMS (3.7%).
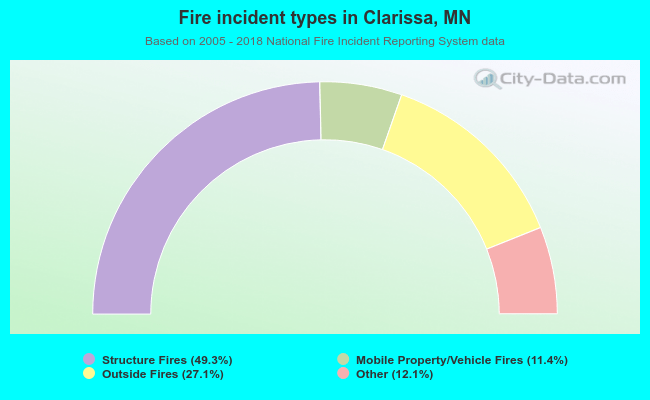 When looking into fire subcategories, the most incidents belonged to: Structure Fires (49.3%), and Outside Fires (27.1%).