| Fire incidents reported |
|---|
| Sreet name | Count |
|---|
| 101 HWY | 50 | | PARKWAY DR | 20 | | SANDLAKE RD | 20 | | GIST RD | 14 | | MP HWY 20 | 14 | | GALLOWAY RD | 10 | | LITTLE NESTUCCA RIVER RD | 10 | | OLD WOODS RD | 8 | | 101 FWY | 4 | | BLANCHARD RD | 4 | | CASCADE ESTATES | 4 | | FRYREAR RD | 4 | | GALLOWAY MP 1 RD | 4 | | HWY 101 | 4 | | HWY 101 HWY | 4 | | HWY 101 S. HWY | 4 | | LEARNED RD | 4 | | MISTY DR | 4 | | PANORAMIC DR | 4 | | VARCO RD | 4 | | WARREN RD | 4 | | WEST ST | 4 | | 101 MP 94 HWY | 2 | | 22 HWY | 2 | | AEOLIAN WAY | 2 |
| | | Fire incidents reported |
|---|
| Sreet name | Count |
|---|
| BEAVER CR. RD | 2 | | BEAVER CREEK | 2 | | BLAINE RD | 2 | | BOUNDRY ROAD BLAINE | 2 | | CAMAS SWALE RD | 2 | | CAMP GROUND ST. ST | 2 | | CAPE KIWANDA DR | 2 | | CASCADE ESTATES DR | 2 | | CEDAR CREEK RD | 2 | | CLOVERDALE RD | 2 | | CONDOR BRIDGE AT HWY 101 | 2 | | FIRE STATION | 2 | | FOREST RD JENCK RD | 2 | | GARDENIA AVE | 2 | | HIGHWAY 101 S | 2 | | HINKLE BUTTE RD | 2 | | HWY 101 AT LNRR | 2 | | HWY 101 MP 101 | 2 | | HWY 101 SOUTH | 2 | | HWY 101S | 2 | | HWY 101SOUTH | 2 | | HWY 126 | 2 | | JENCK | 2 | | JENCK RD | 2 | | JENCK RD. | 2 |
|
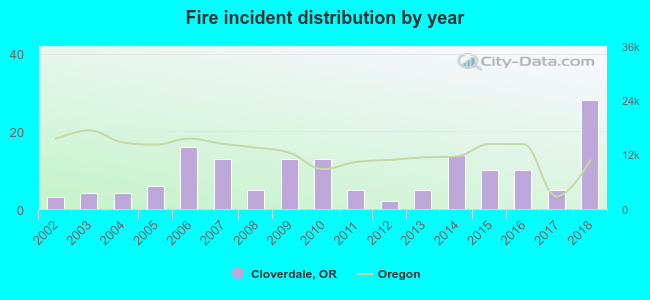 According to the data from the years 2002 - 2018 the average number of fires per year is 9. The highest number of fire incidents - 28 took place in 2018, and the least - 2 in 2012. The data has a growing trend.
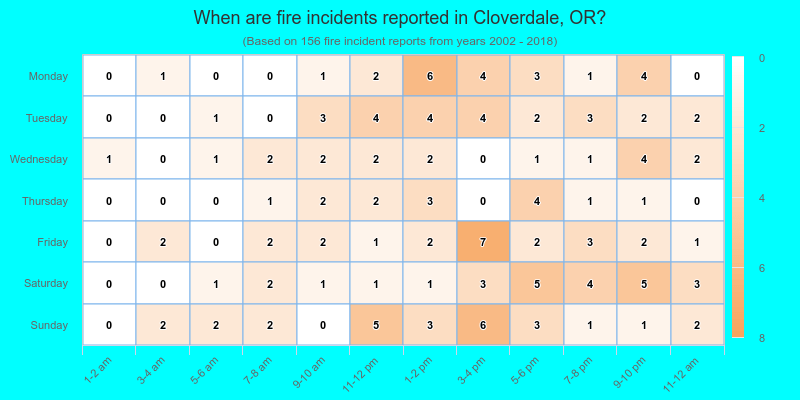
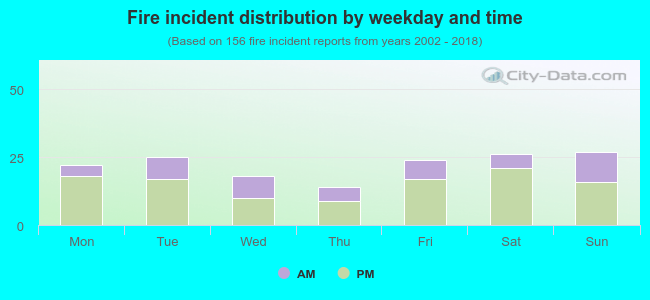 30.8% incidents where reported in the morning and 69.2% in the evening. The most fires (17.3%) took place on Sunday, and the least (9.0%) on Thursday.
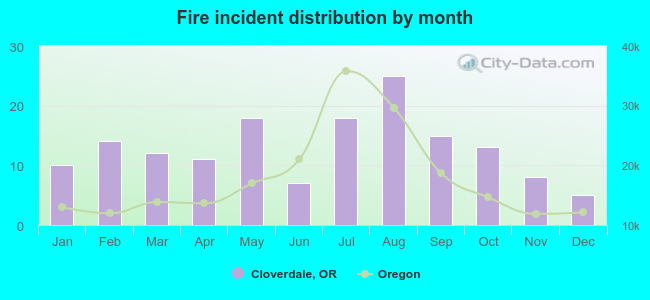 According to the 156 fire incidents from years 2002 - 2018 most fires (16.0%) took place during August, and the least (3.2%) in December.
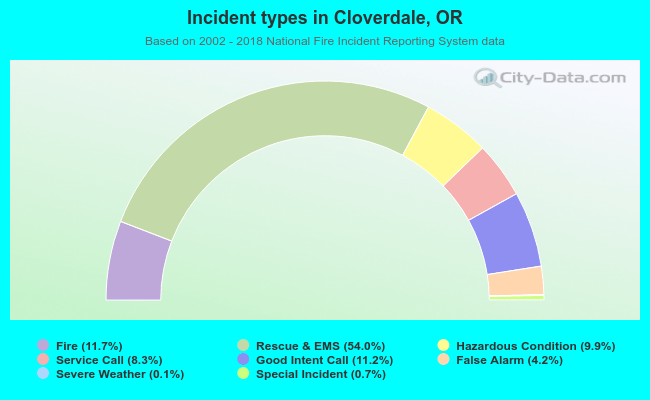 Out of all 1,335 cases reported during the years 2002 - 2018, the most belonged to the categories: Overpressure Rupture (54.0%), Fire (11.7%), and Service Call (11.2%).
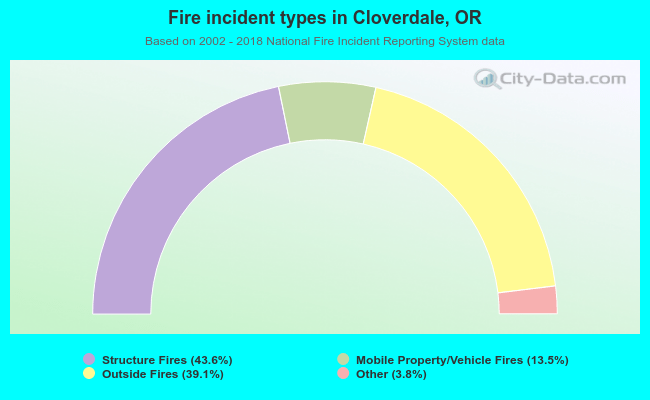 When looking into fire subcategories, the most incidents belonged to: Structure Fires (43.6%), and Outside Fires (39.1%).