| Fire incidents reported |
|---|
| Sreet name | Count |
|---|
| HURRICANE RD | 30 | | ST RTE 8 RT | 28 | | GRANT RD | 18 | | MAIN ST | 18 | | GRAY WILMURT RD | 14 | | FIGERT RD | 10 | | STATE ROUTE 8 | 8 | | STORMY HILL RD | 8 | | BLACK CREEK RD | 6 | | CHRISMAN RD | 6 | | MILITARY RD | 6 | | PARDEVILLE RD | 6 | | ROBERTS RD | 6 | | STATE RTE 8 RT | 6 | | ASH CREEK RD | 4 | | CALIFORNIA RD | 4 | | CHRISTMAN RD | 4 | | COLEMAN RD | 4 | | COOPER RD | 4 | | HARVEY BRIDGE RD | 4 | | KELLER RD | 4 | | KELLY RD | 4 | | MACARTHUR RD | 4 | | NORWAY ST | 4 | | SHAWANGUNK RD | 4 |
| | | Fire incidents reported |
|---|
| Sreet name | Count |
|---|
| ST RTE 8 | 4 | | STATE RT 8 | 4 | | STATE RTE 8 | 4 | | STATE RTE. 8 | 4 | | WARNEY RD | 4 | | 1011 SOUTHSIDE ROAD | 2 | | 1466 GRANT RD. | 2 | | ASH RD | 2 | | ATWOOD LAKE RD | 2 | | BEECHWOOD LN | 2 | | BILLY HAMLIN RD | 2 | | BLACK CREEK RD. | 2 | | BULL HILL RD | 2 | | BURT RD | 2 | | CHRISMAN SPUR RD | 2 | | COLEMAN RD RD | 2 | | CONWAY RD | 2 | | CRAB RD | 2 | | CUMMINGS RD | 2 | | FIVE ACRES LN | 2 | | GRANT RD | 2 | | GRAY WILMURT RD RD | 2 | | GREYWILMURT RD | 2 | | HALL RD | 2 | | HASKELL RD | 2 |
|
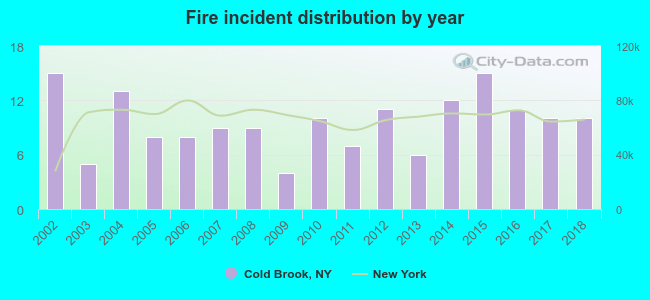 According to the data from the years 2002 - 2018 the average number of fires per year is 10. The highest number of fire incidents - 15 took place in 2002, and the least - 4 in 2009. The data has a declining trend.
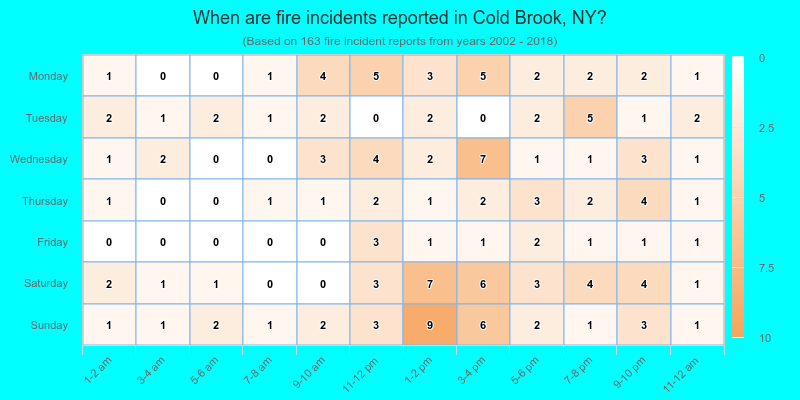
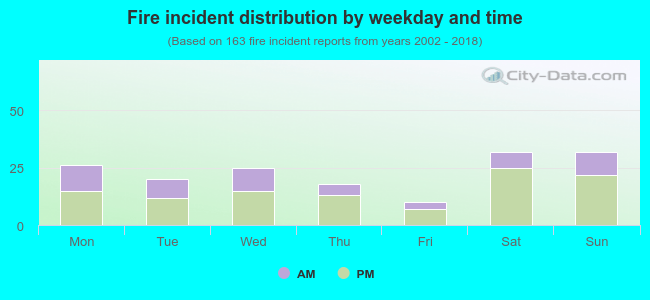 33.1% incidents where reported in the morning and 66.9% in the evening. The most fires (19.6%) took place on Saturday, and the least (6.1%) on Friday.
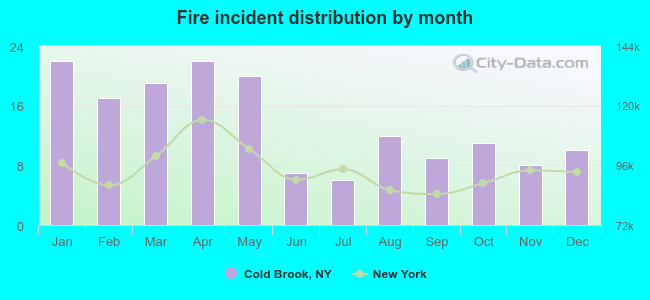 According to the 163 reports from years 2002 - 2018 most fires (13.5%) took place during January, and the least (3.7%) in July.
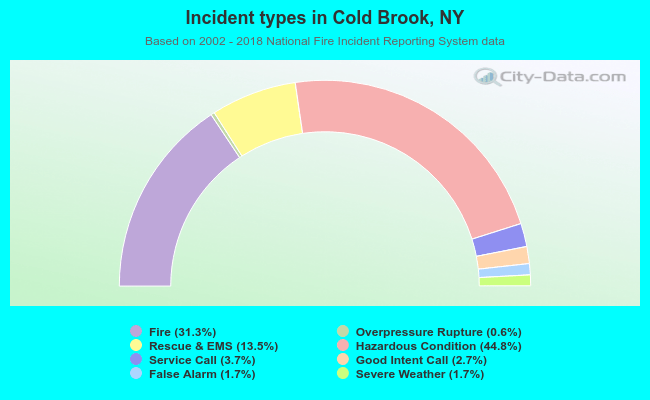 Out of all 520 cases reported during the years 2002 - 2018, the most belonged to the categories: Hazardous Condition (44.8%), Fire (31.3%), and Rescue & EMS (13.5%).
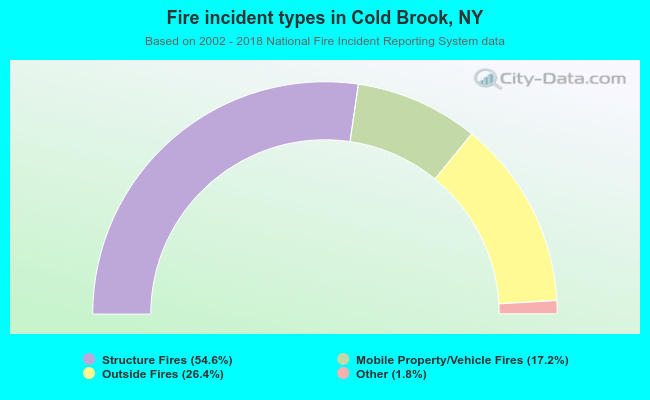 When looking into fire subcategories, the most incidents belonged to: Structure Fires (54.6%), and Outside Fires (26.4%).