College Park: Fire Incidents, Maryland (MD)
Where are fire incidents reported in College Park, MD
Something went wrong! Please refresh the page.
|
| |||||||||||||||||||||||||||||||||||||||||||||||||||||||||||||||||||||||||||||||||||||||||||||||||||||||||||||
2004 - 2018 National Fire Incident Reporting System (NFIRS) incidents
- Incident types reported to NFIRS in College Park, MD
- 3,34878.9%Rescue & EMS
- 2285.4%Good Intent Call
- 2275.4%Fire
- 1974.6%Hazardous Condition
- 1323.1%False Alarm
- 992.3%Service Call
- 90.2%Special Incident
- Fire incident types reported to NFIRS in College Park, MD
- 10345.4%Structure Fires
- 5926.0%Outside Fires
- 4017.6%Other
- 2511.0%Mobile Property/Vehicle Fires
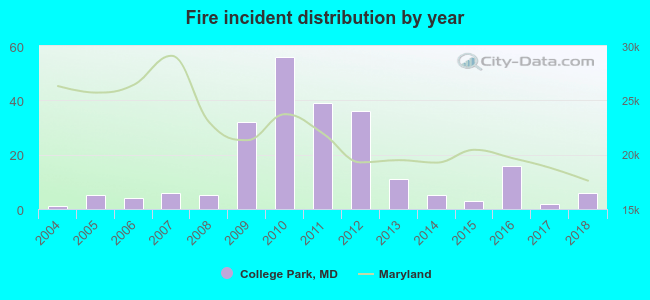 Based on the data from the years 2004 - 2018 the average number of fires per year is 15. The highest number of reported fire incidents - 56 took place in 2010, and the least - 1 in 2004. The data has a growing trend.
The average number of yearly fire incidents per 10k residents in College Park, MD compared to nearest cities:
(Note: Based on data for the last 3 years, including only cities with population 5,000 and above)
| College Park: | 2.5 |
| Adelphi: | 1.1 |
| Greenbelt: | 3.5 |
| Beltsville: | 17.5 |
| Hyattsville: | 52.8 |
| Bladensburg: | 3.5 |
| Lanham: | 14.1 |
| Takoma Park: | 14.0 |
| Mount Rainier: | 8.9 |
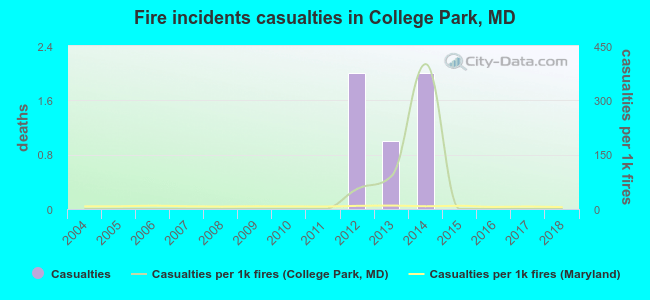 According to the reports from the years 2004 - 2018 the average number of fire-related casualties per year is 0. The highest number of casualties - 2 took place in 2012, and the lowest - 0 in 2004. The data has a constant trend.
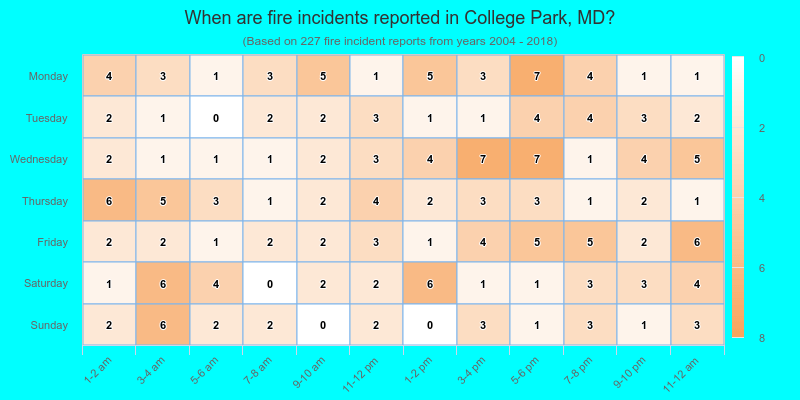
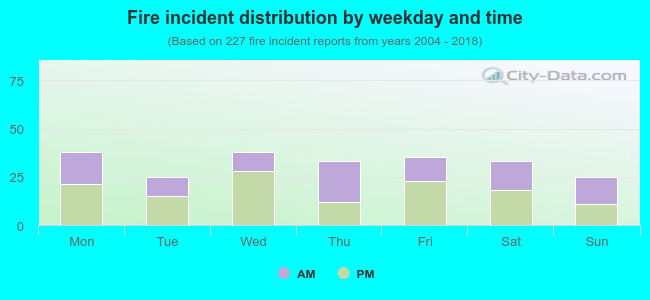 43.6% incidents where reported in the morning and 56.4% in the evening. The most fires (16.7%) took place on Monday, and the least (11.0%) on Tuesday.
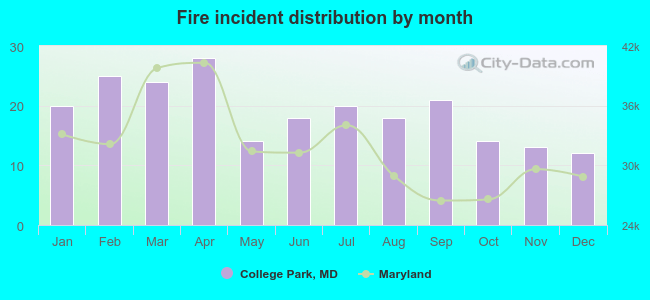 Based on the 227 fires from years 2004 - 2018 most fires (12.3%) took place during April, and the least (5.3%) in December.
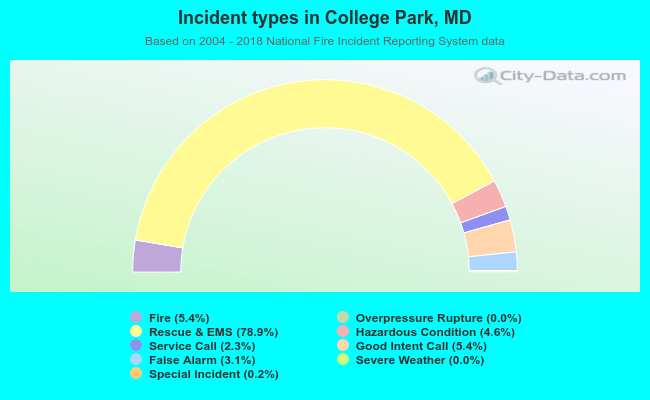 Out of all 4,242 cases reported during the years 2004 - 2018, the most belonged to the categories: Rescue & EMS (78.9%), Good Intent Call (5.4%), and Fire (5.4%).
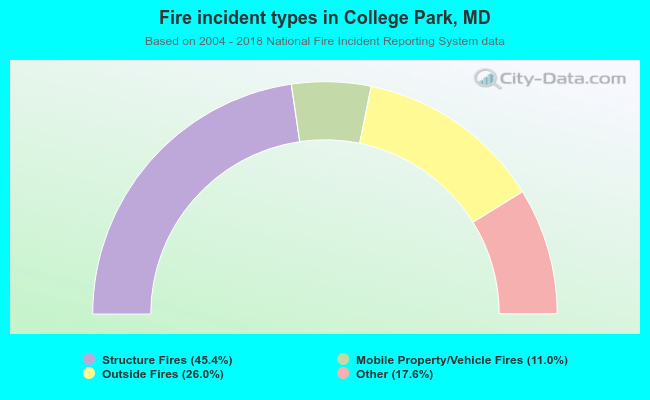 When looking into fire subcategories, the most incidents belonged to: Structure Fires (45.4%), and Outside Fires (26.0%).