| Fire incidents reported |
|---|
| Sreet name | Count |
|---|
| SANDY RUN RD | 10 | | LISTONBURG RD | 8 | | MAE WEST ROAD | 8 | | WILLIAMS ST. | 8 | | LATROBE AVE | 6 | | CRANBERRY RD. | 4 | | FLANIGAN RD | 4 | | HUMBERT RD | 4 | | JACOB ST. | 4 | | JERSEY HOLLOW RD. | 4 | | KINGWOOD RD | 4 | | LOWER TURKEYFOOT TRAIL | 4 | | PARK ST | 4 | | RAMCAT RD | 4 | | STERNER ST | 4 | | WILLIAMS ST | 4 | | 192 WEYAND AVE | 2 | | 281 SOUTH | 2 | | 482 HUGHART ST | 2 | | 826 WILLIAMS STREET | 2 | | 899 CASSELMAN RD | 2 | | ALAN MILLER DR | 2 | | ALAN MILLER DR | 2 | | ANDERSON RD | 2 | | ANDERSON RD. | 2 |
| | | Fire incidents reported |
|---|
| Sreet name | Count |
|---|
| ANDERSON STREET | 2 | | ANGLERS CLUB RD | 2 | | ANGLERS RD. | 2 | | BARLOW ST | 2 | | BEGGS ST. | 2 | | BIG BEND RD. | 2 | | CAMPGROUND RD | 2 | | CAMPGROUND RD | 2 | | CASSELMAN ST | 2 | | CHICKEN BONE RD. | 2 | | COLFLESH RD | 2 | | COLFLESH RD | 2 | | COLFLESH RD. | 2 | | COLFLESH ROAD | 2 | | CONN RD | 2 | | CONN RD. | 2 | | CONN ROAD | 2 | | COON HOLLOW RD | 2 | | COON HOLLOW RD | 2 | | COON HOLLOW RD. | 2 | | DEAN ST | 2 | | DEAN STREET | 2 | | DEER HAVEN LANE | 2 | | DULL HILL RD | 2 | | |
|
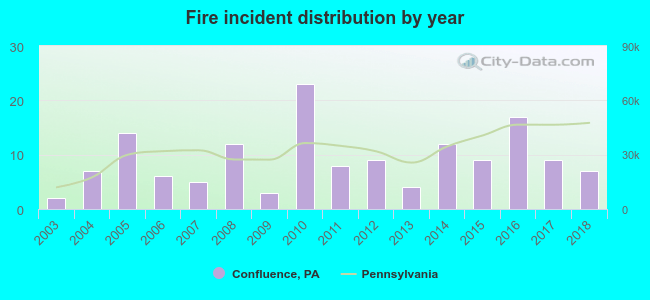 Based on the data from the years 2003 - 2018 the average number of fire incidents per year is 9. The highest number of fires - 23 took place in 2010, and the least - 2 in 2003. The data has a growing trend.
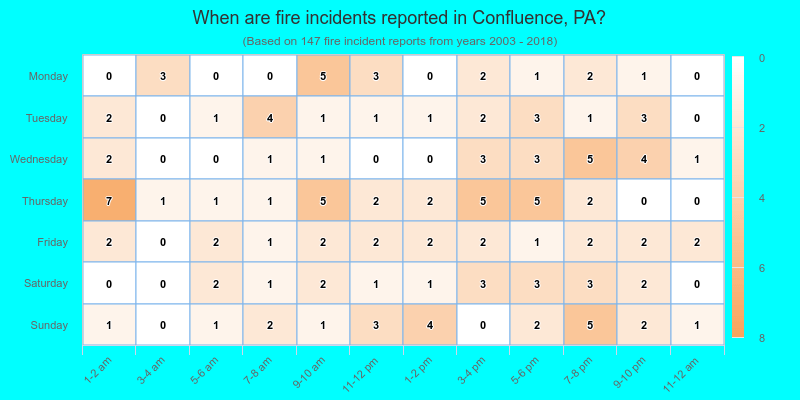
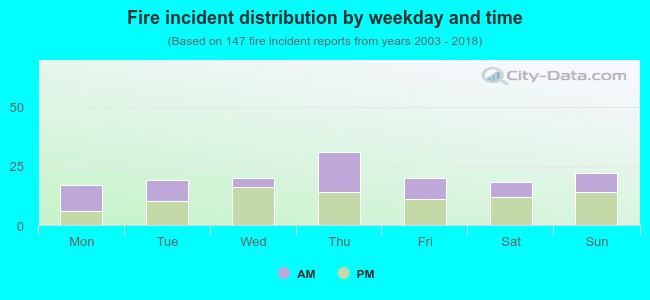 43.5% incidents where reported in the morning and 56.5% in the evening. The most fires (21.1%) took place on Thursday, and the least (11.6%) on Monday.
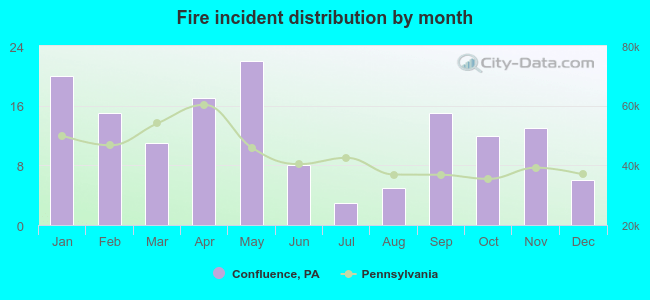 According to the 147 fires from years 2003 - 2018 most fires (15.0%) took place during May, and the least (2.0%) in July.
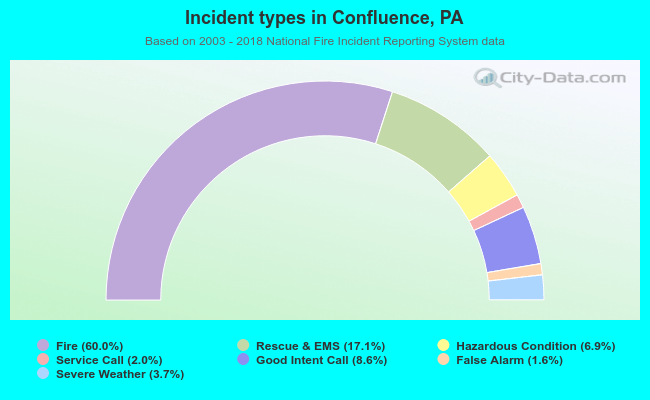 Out of all 245 cases reported during the years 2003 - 2018, the most belonged to the categories: Fire (60.0%), Overpressure Rupture (17.1%), and Service Call (8.6%).
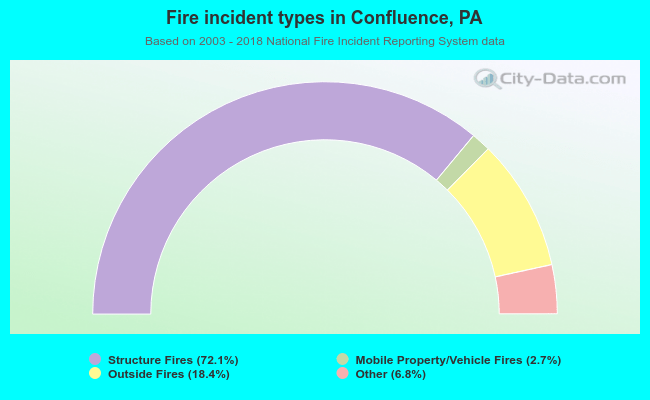 When looking into fire subcategories, the most incidents belonged to: Structure Fires (72.1%), and Outside Fires (18.4%).