| Fire incidents reported |
|---|
| Sreet name | Count |
|---|
| PORTLAND DR | 6 | | ST. LUKE RD. | 6 | | 105 STARVEY CREEK RD | 4 | | 118 I-44 | 4 | | 2583 REED RD | 4 | | 59 BETHEL RD | 4 | | BLACK HORSE RD | 4 | | COMMERCIAL | 4 | | HWY ZZ | 4 | | I-44 111 WB | 4 | | MICA DR | 4 | | RUBEY ST | 4 | | STATE HIGHWAY CC | 4 | | STATE HIGHWAY Y | 4 | | STATE HWY Y | 4 | | STRAIGHT RD | 4 | | 10339 CATTAIL RD | 2 | | 105 MARTINGALE DR | 2 | | 107 W CHERRY | 2 | | 110 EB I-44 | 2 | | 1105 MARBLE DR | 2 | | 1105 MARBLE RD | 2 | | 111 MM EB I44 | 2 | | 111 W RUBY | 2 | | 1114 MYRTEL ST | 2 |
| | | Fire incidents reported |
|---|
| Sreet name | Count |
|---|
| 1128 EB I44 | 2 | | 113 I44 WB | 2 | | 114 I-44 | 2 | | 11474 ORCHID | 2 | | 1158 I44 WB | 2 | | 116.2 I-44 EB | 2 | | 117 MACMHAN | 2 | | 11725 MERCURY DR | 2 | | 118 EB I-44 | 2 | | 119 E/B I-44 | 2 | | 121 I-44 EB | 2 | | 12154 MONTANA DR | 2 | | 14059 J HWY LGTS | 2 | | 14292 OURLOOK | 2 | | 14732 HIGHWAY C | 2 | | 1523 SAMPSON | 2 | | 16219 ST HWY W | 2 | | 165 SAMPSON RD | 2 | | 16690 CAMPGROUND RD | 2 | | 17250 CAMPGROUND RD | 2 | | 1744 WILDWOOD RD | 2 | | 17750 MONROE DR | 2 | | 18071 NELLWOOD LN | 2 | | 18701 NELLWOOD LN | 2 | | |
|
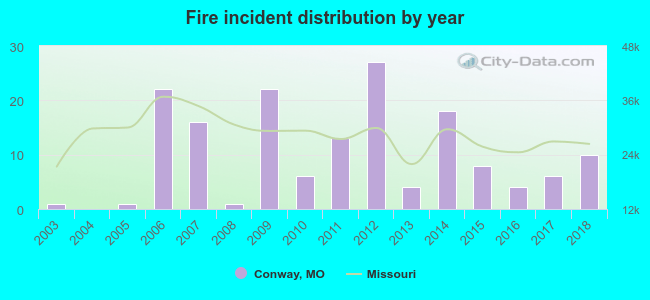 Based on the data from the years 2003 - 2018 the average number of fires per year is 10. The highest number of fire incidents - 27 took place in 2012, and the least - 0 in 2004. The data has an increasing trend.
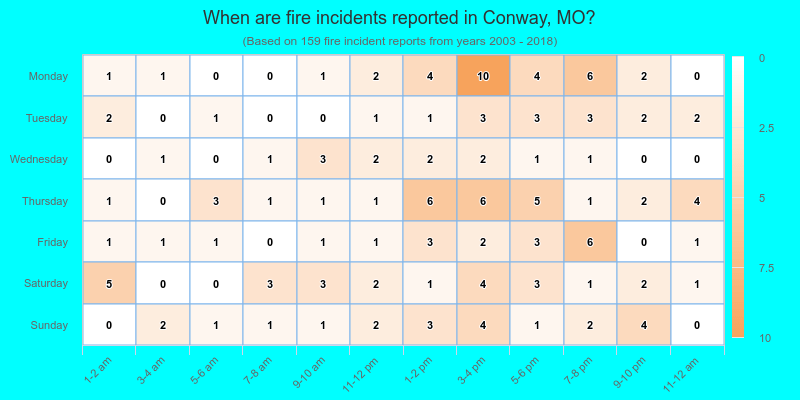
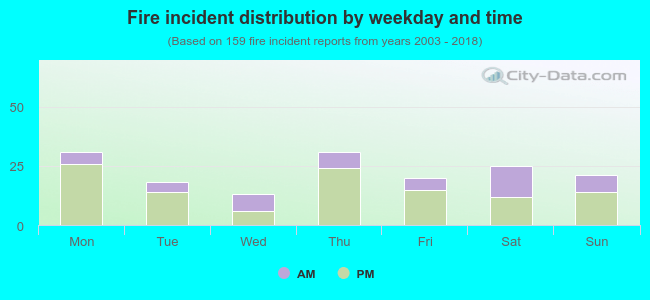 30.2% incidents where reported in the morning and 69.8% in the evening. The most fires (19.5%) took place on Monday, and the least (8.2%) on Wednesday.
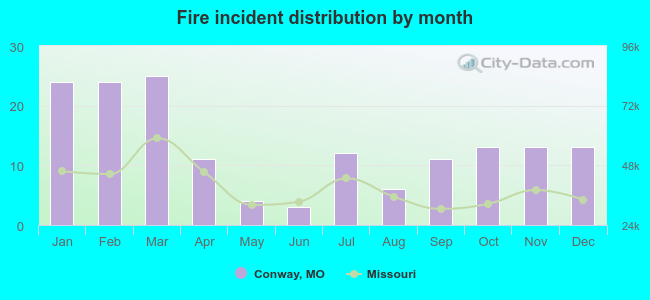 According to the 159 fires from years 2003 - 2018 most fires (15.7%) took place during March, and the least (1.9%) in June.
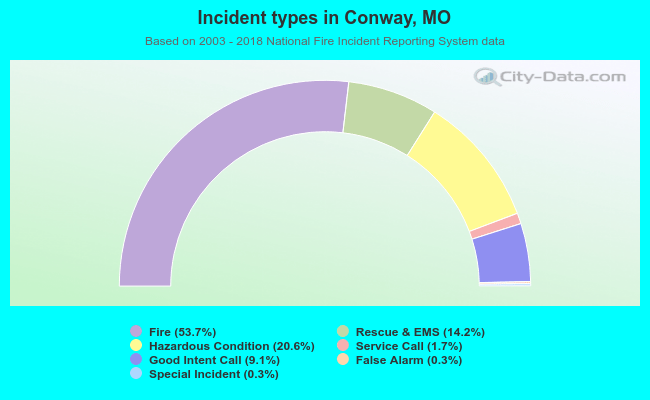 Out of all 296 cases reported during the years 2003 - 2018, the most belonged to the categories: Fire (53.7%), Rescue & EMS (20.6%), and Overpressure Rupture (14.2%).
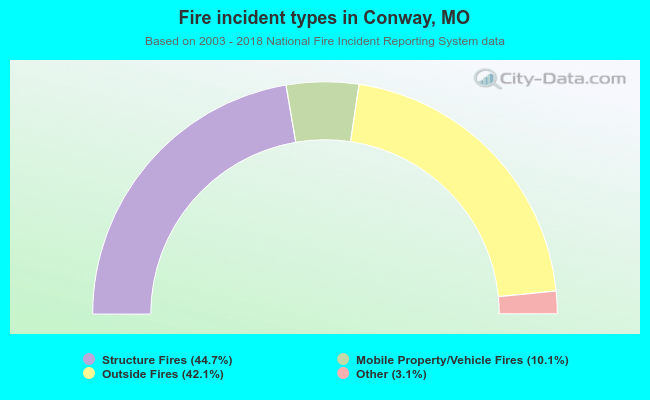 When looking into fire subcategories, the most reports belonged to: Structure Fires (44.7%), and Outside Fires (42.1%).