Coppell: Fire Incidents, Texas (TX)
Where are fire incidents reported in Coppell, TX
Something went wrong! Please refresh the page.
| Fire incidents reported | |
|---|---|
| Sreet name | Count |
| SANDY LAKE RD | 178 |
| MACARTHUR BLVD | 146 |
| MOORE RD | 118 |
| PARKWAY BLVD | 114 |
| DENTON TAP RD | 84 |
| BELTLINE RD | 66 |
| COPPELL RD | 64 |
| BELT LINE RD | 58 |
| BETHEL RD | 50 |
| AIRLINE DR | 46 |
| IH 635 HWY | 46 |
| RIVERCHASE DR | 46 |
| SAMUEL BLVD | 42 |
| STATE HWY 121 HWY | 42 |
| FREEPORT | 38 |
| ROYAL LN | 34 |
| 635 HWY | 30 |
| FREEPORT PKY | 30 |
| MOCKINGBIRD LN | 24 |
| NORTHPOINT DR | 24 |
| FAIRWAY DR | 22 |
| CANYON DR | 20 |
| DIVIDEND DR | 20 |
| RUBY RD | 18 |
| SOUTHWESTERN BLVD | 18 |
| 121 HWY | 16 |
| I635 HWY | 16 |
| MINYARD DR | 16 |
| ZCOPPELL | 16 |
| ARBOR BROOK LN | 14 |
2002 - 2018 National Fire Incident Reporting System (NFIRS) incidents
- Incident types reported to NFIRS in Coppell, TX
- 10,19251.5%Rescue & EMS
- 2,71413.7%False Alarm
- 2,04510.3%Hazardous Condition
- 1,8589.4%Service Call
- 1,5007.6%Good Intent Call
- 1,4017.1%Fire
- 350.2%Severe Weather
- 290.1%Overpressure Rupture
- Fire incident types reported to NFIRS in Coppell, TX
- 64846.3%Outside Fires
- 50135.8%Structure Fires
- 20514.6%Mobile Property/Vehicle Fires
- 473.4%Other
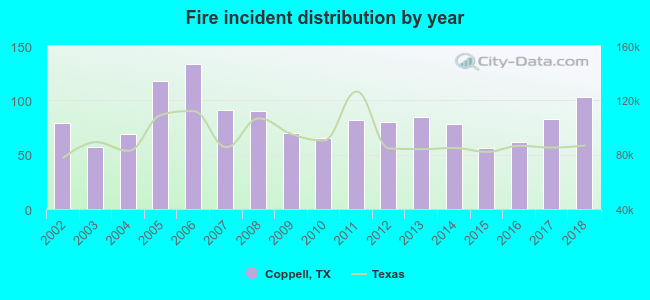 Based on the data from the years 2002 - 2018 the average number of fire incidents per year is 82. The highest number of fires - 133 took place in 2006, and the least - 56 in 2015. The data has a rising trend.
The average number of yearly fire incidents per 10k residents in Coppell, TX compared to nearest cities:
(Note: Based on data for the last 3 years, including only cities with population 5,000 and above)
| Coppell: | 20.3 |
| Lewisville: | 27.2 |
| Carrollton: | 24.4 |
| Grapevine: | 35.5 |
| Farmers Branch: | 29.3 |
| Flower Mound: | 16.0 |
| Irving: | 21.8 |
| Addison: | 50.9 |
| Highland Village: | 24.0 |
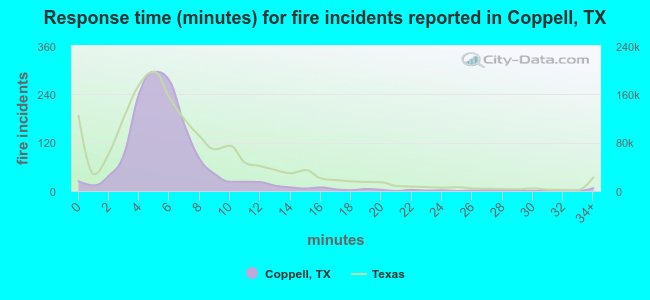 The median response time based on all reported fire incidents is 5 minutes. This is lower compared to the state median value.
The median response time in Coppell, TX compared to nearest cities:
(Note: Based on data for all years, including only cities with at least 500 fire incidents)
| Coppell: | 5 minutes |
| Lewisville: | 5 minutes |
| Carrollton: | 5 minutes |
| Grapevine: | 5 minutes |
| Farmers Branch: | 5 minutes |
| Flower Mound: | 6 minutes |
| Irving: | 5 minutes |
| Addison: | 5 minutes |
| Highland Village: | 7 minutes |
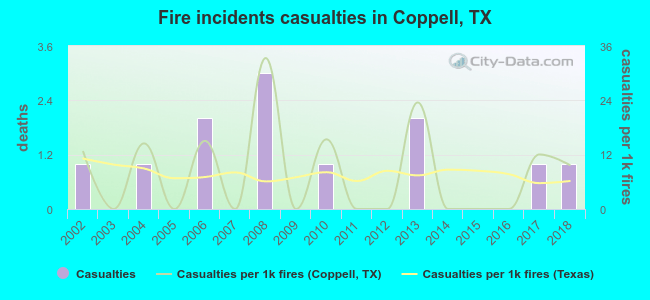 Based on the reports from the years 2002 - 2018 the average number of fire-related casualties per year is 1. The highest number of reported injuries - 3 took place in 2008, and the lowest - 0 in 2003. The data has a constant trend.
The average number of casualties per 1,000 fires is 8. This indicator was the highest - 33 in 2008, and the lowest 0 in 2003. The trend for injuries per 1,000 incidents is dropping. Compared to the Texas value the number of injuries per 1,000 incidents is about the same.
Based on the reports from the years 2002 - 2018 the average number of fire-related casualties per year is 1. The highest number of reported injuries - 3 took place in 2008, and the lowest - 0 in 2003. The data has a constant trend.
The average number of casualties per 1,000 fires is 8. This indicator was the highest - 33 in 2008, and the lowest 0 in 2003. The trend for injuries per 1,000 incidents is dropping. Compared to the Texas value the number of injuries per 1,000 incidents is about the same.Casualties per 1,000 incidents in Coppell, TX compared to nearest cities:
(Note: Based on data for all years, including only cities with at least 500 fire incidents)
| Coppell: | 8.6 |
| Lewisville: | 8.1 |
| Carrollton: | 14.1 |
| Grapevine: | 9.2 |
| Farmers Branch: | 14.7 |
| Flower Mound: | 21.1 |
| Irving: | 7.0 |
| Addison: | 4.6 |
| Highland Village: | 0.0 |
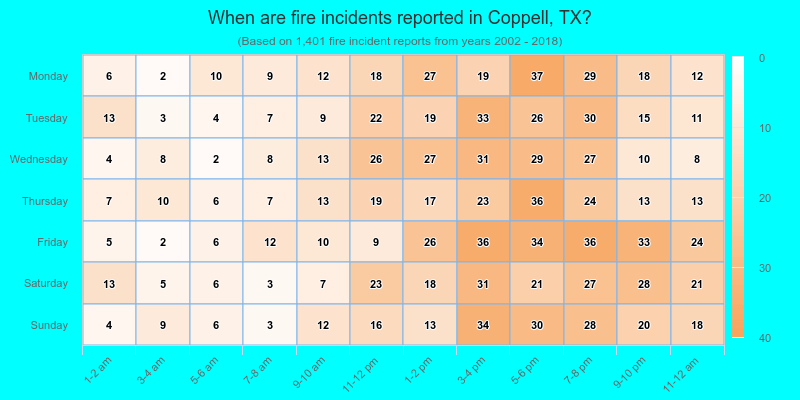
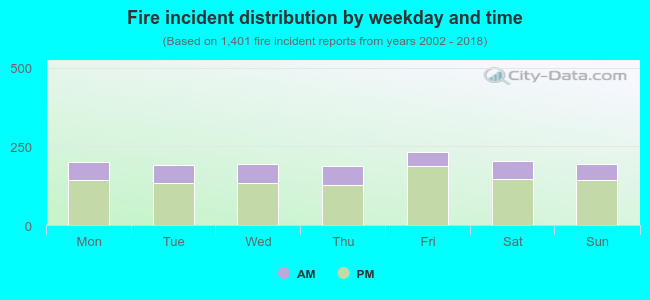 27.8% incidents where reported in the morning and 72.2% in the evening. The most fires (16.6%) took place on Friday, and the least (13.4%) on Thursday.
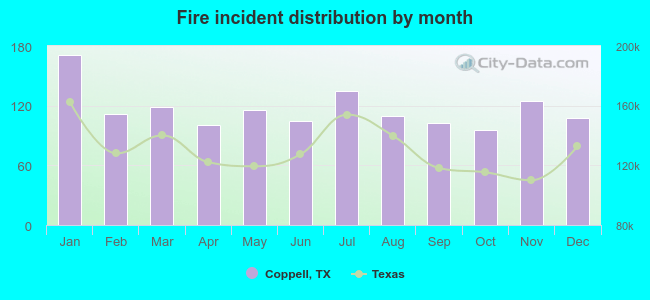 Based on the 1,401 fire incident reports from years 2002 - 2018 most fires (12.2%) took place during January, and the least (6.9%) in October.
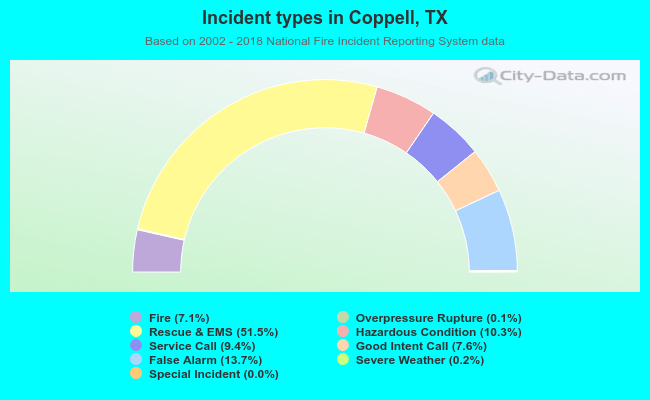 Out of all 19,782 cases reported during the years 2002 - 2018, the most belonged to the categories: Rescue & EMS (51.5%), False Alarm (13.7%), and Hazardous Condition (10.3%).
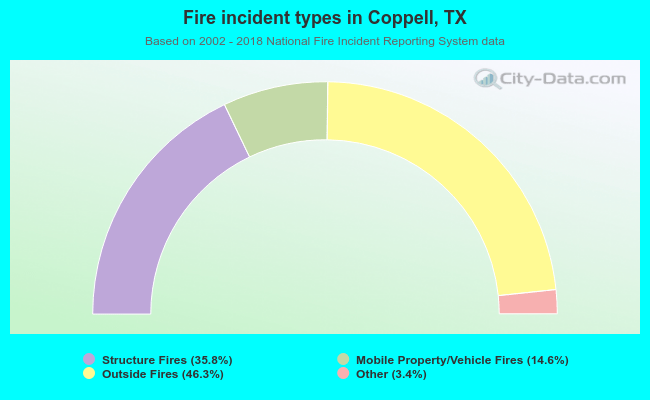 When looking into fire subcategories, the most incidents belonged to: Outside Fires (46.3%), and Structure Fires (35.8%).