Covington: Fire Incidents, Texas (TX)
Where are fire incidents reported in Covington, TX
Something went wrong! Please refresh the page.
|
| |||||||||||||||||||||||||||||||||||||||||||||||||||||||||||||||||||||||||||||||||||||||||||||||||||||||||||||
| Other | 48 | |||||||||||||||||||||||||||||||||||||||||||||||||||||||||||||||||||||||||||||||||||||||||||||||||||||||||||||
2003 - 2018 National Fire Incident Reporting System (NFIRS) incidents
- Incident types reported to NFIRS in Covington, TX
- 34462.3%Fire
- 7012.7%Rescue & EMS
- 519.2%Service Call
- 417.4%Good Intent Call
- 397.1%Hazardous Condition
- 30.5%False Alarm
- 30.5%Severe Weather
- 10.2%Special Incident
- Fire incident types reported to NFIRS in Covington, TX
- 25574.1%Outside Fires
- 5014.5%Structure Fires
- 257.3%Mobile Property/Vehicle Fires
- 144.1%Other
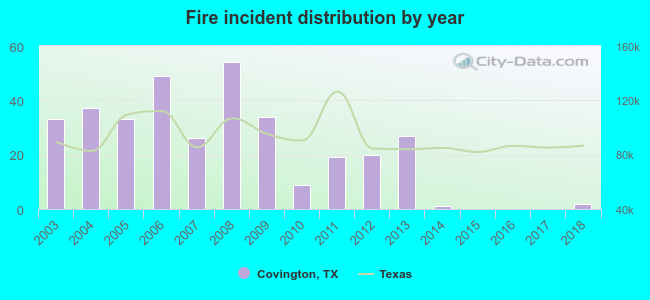 According to the data from the years 2003 - 2018 the average number of fires per year is 22. The highest number of reported fires - 54 took place in 2008, and the least - 0 in 2015. The data has a dropping trend.
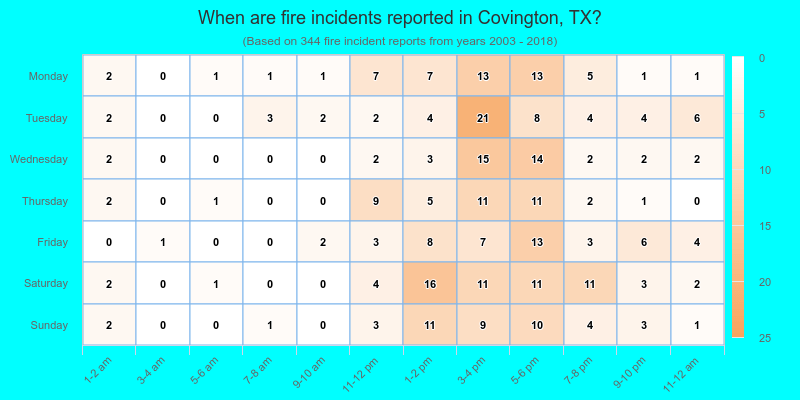
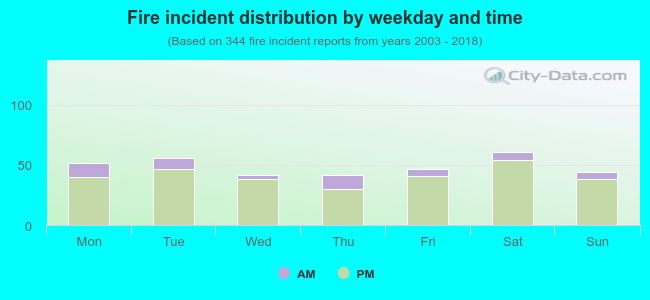 16.3% incidents where reported in the morning and 83.7% in the evening. The most fires (17.7%) took place on Saturday, and the least (12.2%) on Wednesday.
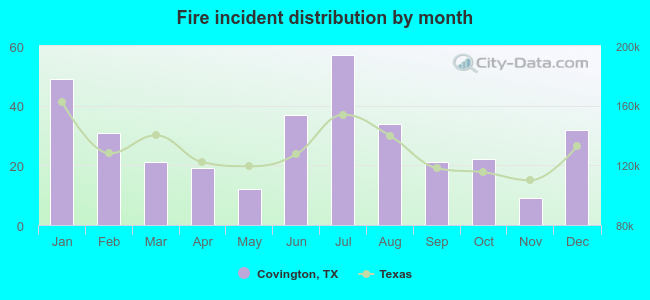 Based on the 344 fire incidents from years 2003 - 2018 most fires (16.6%) took place during July, and the least (2.6%) in November.
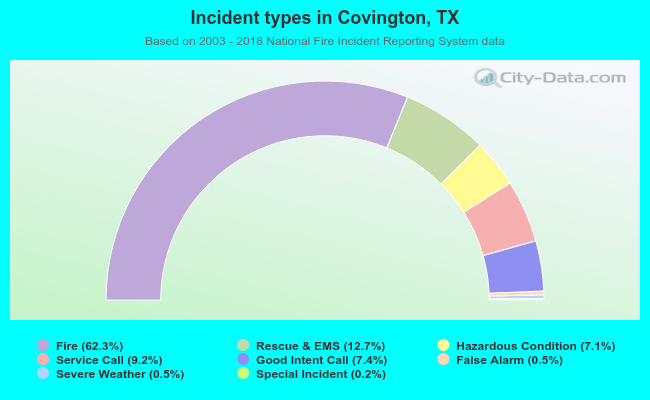 Out of all 552 cases reported during the years 2003 - 2018, the most belonged to the categories: Fire (62.3%), Overpressure Rupture (12.7%), and Hazardous Condition (9.2%).
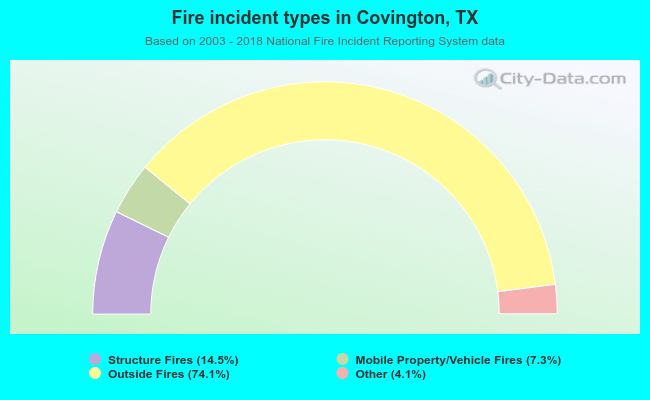 When looking into fire subcategories, the most reports belonged to: Outside Fires (74.1%), and Structure Fires (14.5%).