| Fire incidents reported |
|---|
| Sreet name | Count |
|---|
| GLENVIEW RD | 20 | | CARTER AVE | 14 | | ROBERT C BYRD DR | 14 | | CARTER AVE | 12 | | FEARN ST | 10 | | GLEN VIEW RD | 10 | | GLENVIEW ROAD RD | 10 | | ROBERT C. BYRD DR | 10 | | OLD GROVE RD | 8 | | 153 HATFIELD RD | 6 | | BRETHERN ROAD RD | 6 | | FERN ST | 6 | | GRAY RD | 6 | | OAK AVE | 6 | | OLD GROVE RD. | 6 | | OLD GROVE ROAD RD | 6 | | STONEY AVE | 6 | | 105 PEBBLESTONE DR | 4 | | 123 AVERY STREET | 4 | | 1427ROBERT C BYRD DR | 4 | | 153 HATFIELD RD | 4 | | 185 STONEY AVE | 4 | | 189 STOVERS FORK RD | 4 | | 204 BARNES CT | 4 | | 290 RUSTIC HILLS DR | 4 |
| | | Fire incidents reported |
|---|
| Sreet name | Count |
|---|
| AVERY ST | 4 | | BOYD LANE LN | 4 | | BRETHREN RD | 4 | | BRETHREN RD | 4 | | CARTER ADDITION | 4 | | CARTER AVE. | 4 | | CEDAR RD. | 4 | | FEARN ST | 4 | | GLENVIEW ROAD ROAD | 4 | | GREY RD | 4 | | OAK AVE | 4 | | ORCHARD WOOD DR | 4 | | ORCHARD WOODS DRIVE DR | 4 | | PERSINGER ST | 4 | | ROBERT C BYRD DR | 4 | | ROBERT C BYRD DRIVE | 4 | | RUSTIC HILLS DR | 4 | | TAYLOR ST | 4 | | 100 BOLTON DR | 2 | | 100399 RUSTIC HILLS DR | 2 | | 108SHEPHERD LN | 2 | | 109 WHITE OAK DR. | 2 | | 109 WHITE OAK RD. | 2 | | 112 STONEY AVE RD | 2 | | 112 STONEY AVE. | 2 |
|
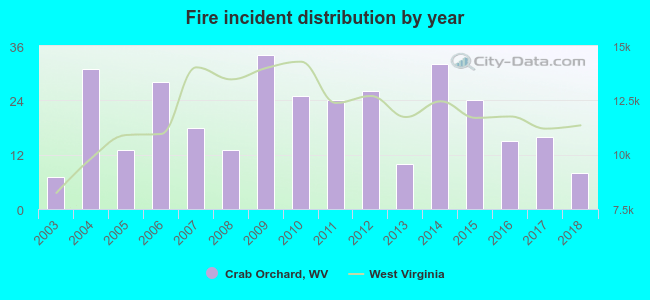 Based on the data from the years 2003 - 2018 the average number of fires per year is 20. The highest number of reported fires - 34 took place in 2009, and the least - 7 in 2003. The data has a growing trend.
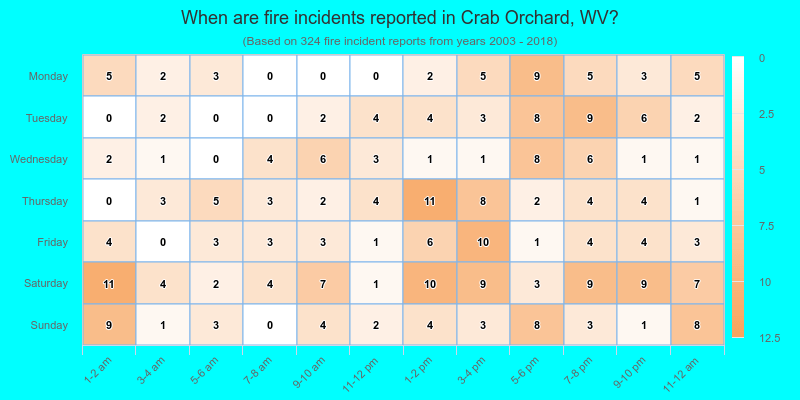
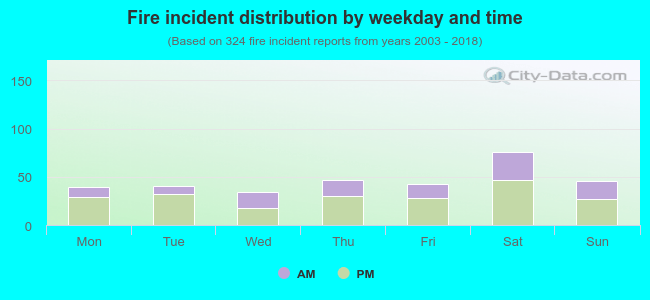 34.9% incidents where reported in the morning and 65.1% in the evening. The most fires (23.5%) took place on Saturday, and the least (10.5%) on Wednesday.
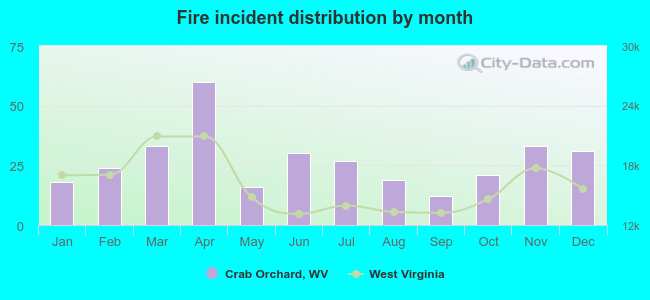 According to the 324 incident reports from years 2003 - 2018 most fires (18.5%) took place during April, and the least (3.7%) in September.
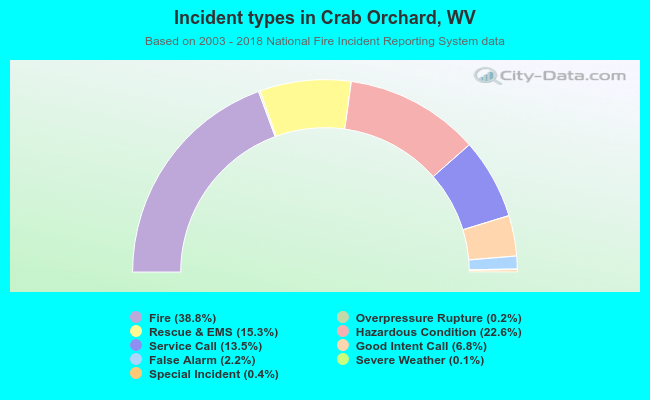 Out of all 835 cases reported during the years 2003 - 2018, the most belonged to the categories: Fire (38.8%), Hazardous Condition (22.6%), and Rescue & EMS (15.3%).
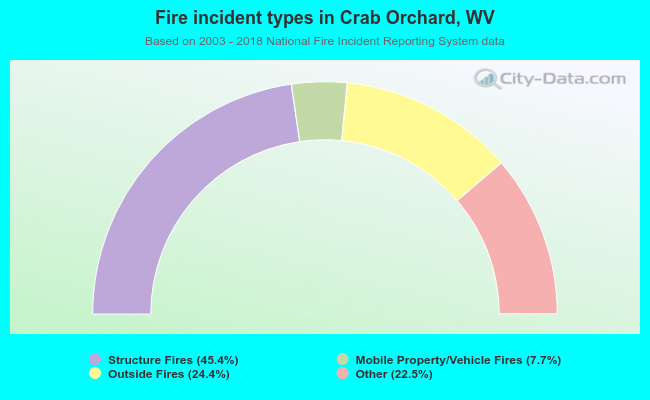 When looking into fire subcategories, the most reports belonged to: Structure Fires (45.4%), and Outside Fires (24.4%).