Crafton: Fire Incidents, Pennsylvania (PA)
Where are fire incidents reported in Crafton, PA
Something went wrong! Please refresh the page.
|
| |||||||||||||||||||||||||||||||||||||||||||||||||||||||||||||||||||||||||||||||||||||||||||||||||||||||||||||
2003 - 2018 National Fire Incident Reporting System (NFIRS) incidents
- Incident types reported to NFIRS in Crafton, PA
- 29333.5%Rescue & EMS
- 22225.4%Hazardous Condition
- 13715.7%Fire
- 9110.4%False Alarm
- 677.7%Good Intent Call
- 495.6%Service Call
- 91.0%Severe Weather
- 60.7%Overpressure Rupture
- Fire incident types reported to NFIRS in Crafton, PA
- 9770.8%Structure Fires
- 2115.3%Outside Fires
- 128.8%Mobile Property/Vehicle Fires
- 75.1%Other
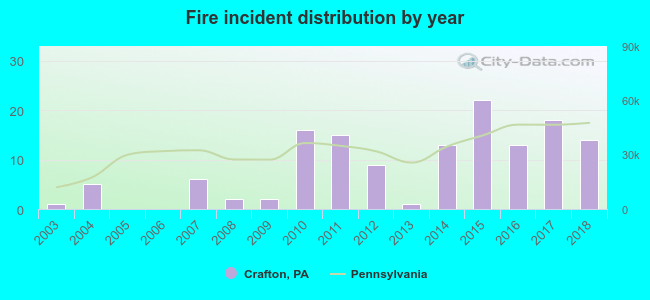 Based on the data from the years 2003 - 2018 the average number of fires per year is 9. The highest number of fire incidents - 22 took place in 2015, and the least - 0 in 2005. The data has a rising trend.
The average number of yearly fire incidents per 10k residents in Crafton, PA compared to nearest cities:
(Note: Based on data for the last 3 years, including only cities with population 5,000 and above)
| Crafton: | 25.4 |
| Carnegie: | 28.2 |
| McKees Rocks: | 72.8 |
| Scott Township: | 10.7 |
| Stowe Township: | 3.1 |
| Dormont: | 26.6 |
| Robinson Township: | 5.5 |
| Kennedy Township: | 3.5 |
| Bellevue: | 45.8 |
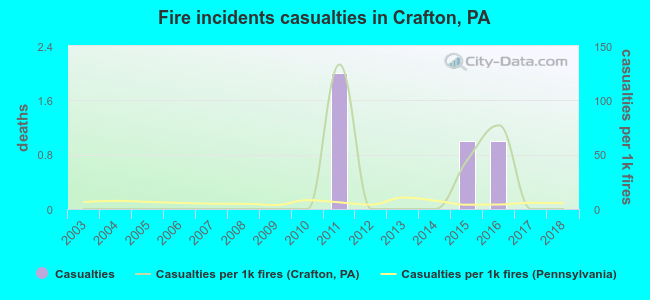 According to the reports from the years 2003 - 2018 the average number of fire-related yearly casualties is 0. The highest number of casualties - 2 took place in 2011, and the lowest - 0 in 2003. The data has a constant trend.
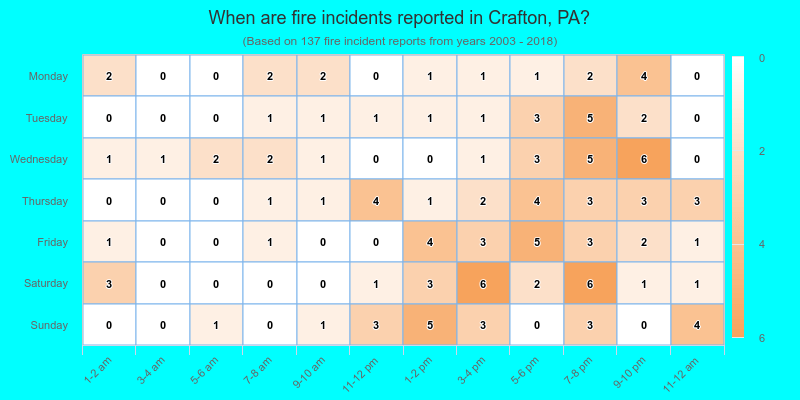
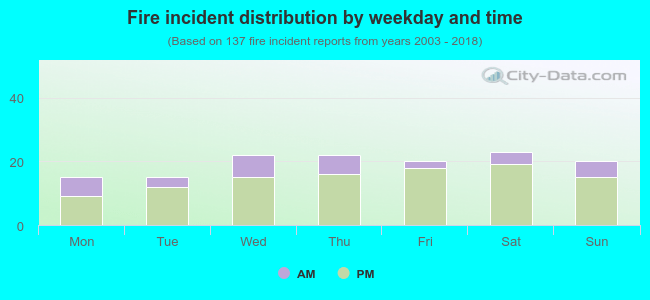 24.1% incidents where reported in the morning and 75.9% in the evening. The most fires (16.8%) took place on Saturday, and the least (10.9%) on Monday.
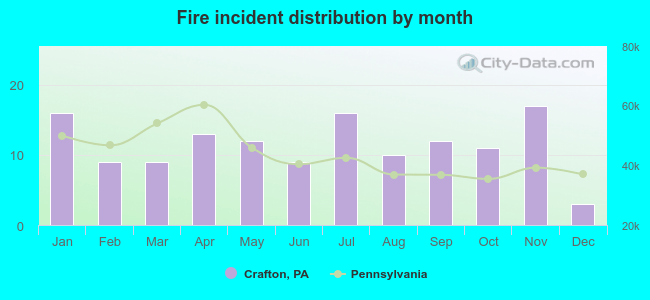 According to the 137 reports from years 2003 - 2018 most fires (12.4%) took place during November, and the least (2.2%) in December.
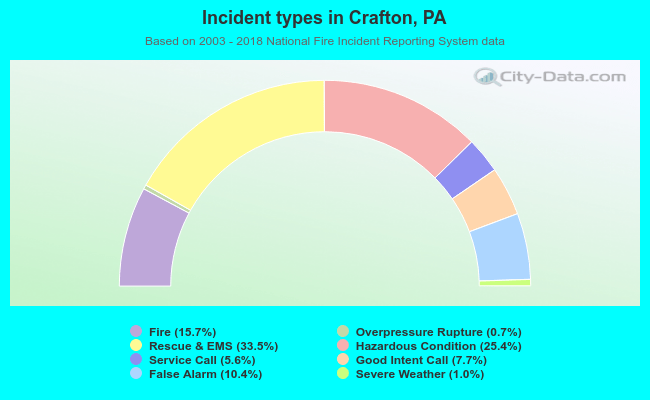 Out of all 874 cases reported during the years 2003 - 2018, the most belonged to the categories: Rescue & EMS (33.5%), Hazardous Condition (25.4%), and Fire (15.7%).
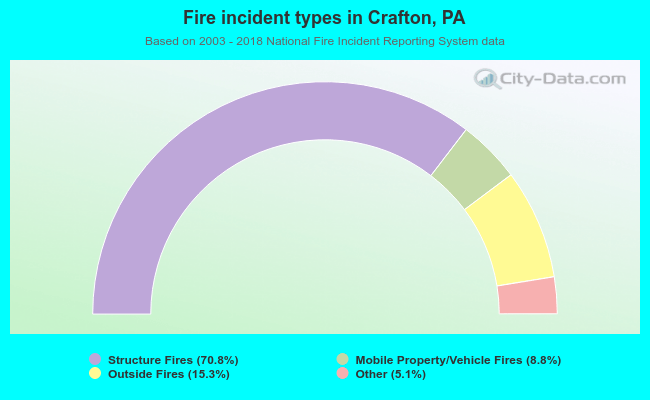 When looking into fire subcategories, the most reports belonged to: Structure Fires (70.8%), and Outside Fires (15.3%).