Cranford: Fire Incidents, New Jersey (NJ)
Where are fire incidents reported in Cranford, NJ
Something went wrong! Please refresh the page.
| Fire incidents reported | |
|---|---|
| Sreet name | Count |
| GARDEN STATE PKY | 172 |
| NORTH AVE | 128 |
| SOUTH AVE | 118 |
| WALNUT AVE | 98 |
| SPRINGFIELD AVE | 94 |
| UNION AVE | 90 |
| LINCOLN AVE | 72 |
| CENTENNIAL AVE | 56 |
| JACKSON DR | 50 |
| BURNSIDE AVE | 38 |
| COMMERCE DR | 36 |
| HIGH ST | 34 |
| HILLSIDE AVE | 30 |
| LEXINGTON AVE | 30 |
| ORANGE AVE | 30 |
| RARITAN RD | 28 |
| BLOOMINGDALE AVE | 24 |
| RIVERSIDE DR | 24 |
| JOHNSON AVE | 22 |
| MEEKER AVE | 22 |
| CRANFORD AVE | 20 |
| MYRTLE ST | 20 |
| HERNING AVE | 18 |
| BIRCHWOOD AVE | 16 |
| LINCOLN PARK | 16 |
| WINANS AVE | 16 |
| GARDEN STATE PKY | 14 |
| HILLCREST AVE | 14 |
| LEHIGH AVE | 14 |
| LENHOME DR | 14 |
2003 - 2018 National Fire Incident Reporting System (NFIRS) incidents
- Incident types reported to NFIRS in Cranford, NJ
- 5,82734.8%Rescue & EMS
- 5,04730.2%Hazardous Condition
- 2,76116.5%False Alarm
- 1,4208.5%Service Call
- 1,1566.9%Fire
- 4412.6%Good Intent Call
- 340.2%Severe Weather
- 270.2%Overpressure Rupture
- Fire incident types reported to NFIRS in Cranford, NJ
- 57850.0%Structure Fires
- 37932.8%Outside Fires
- 18816.3%Mobile Property/Vehicle Fires
- 111.0%Other
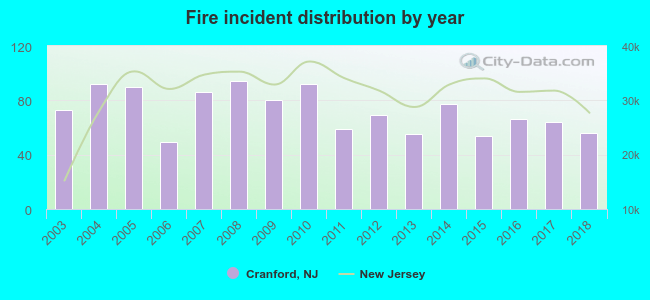 Based on the data from the years 2003 - 2018 the average number of fire incidents per year is 72. The highest number of fire incidents - 94 took place in 2008, and the least - 49 in 2006. The data has a declining trend.
The average number of yearly fire incidents per 10k residents in Cranford, NJ compared to nearest cities:
(Note: Based on data for the last 3 years, including only cities with population 5,000 and above)
| Cranford: | 27.6 |
| Kenilworth: | 14.3 |
| Roselle Park: | 13.5 |
| Westfield: | 18.3 |
| Roselle: | 24.1 |
| Clark: | 30.3 |
| Mountainside: | 19.0 |
| Linden: | 28.5 |
| Springfield: | 44.0 |
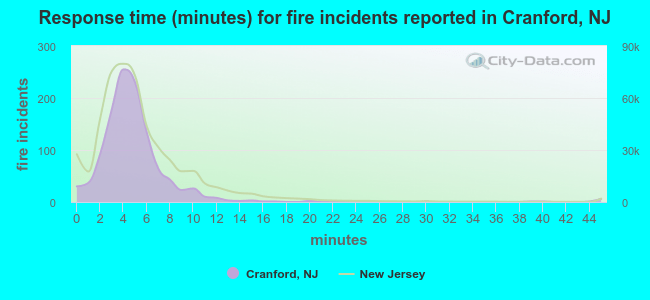 The median response time based on all reported fire incidents is 4 minutes. This is lower compared to the state median value.
The median response time in Cranford, NJ compared to nearest cities:
(Note: Based on data for all years, including only cities with at least 500 fire incidents)
| Cranford: | 4 minutes |
| Westfield: | 3 minutes |
| Roselle: | 3 minutes |
| Clark: | 6 minutes |
| Linden: | 4 minutes |
| Springfield: | 5 minutes |
| Union: | 5 minutes |
| Rahway: | 3 minutes |
| Scotch Plains: | 6 minutes |
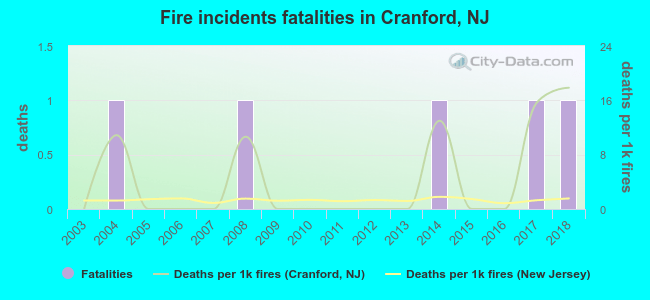 According to the data from the years 2003 - 2018 the average number of fire-related fatalities per year is 0. The highest number of deaths - 1 took place in 2004, and the lowest - 0 in 2003. The data has a rising trend.
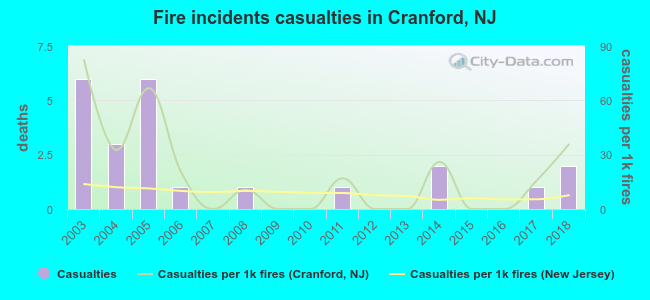 According to the data from the years 2003 - 2018 the average number of fire-related casualties per year is 1. The highest number of reported injuries - 6 took place in 2003, and the lowest - 0 in 2007. The data has a decreasing trend.
The average number of injuries per 1,000 fires is 19. This indicator was the highest - 82 in 2003, and the lowest 0 in 2007. The trend for casualties per 1,000 fire incidents is declining. Compared to the state value the number of injuries per 1,000 incidents is much higher.
According to the data from the years 2003 - 2018 the average number of fire-related casualties per year is 1. The highest number of reported injuries - 6 took place in 2003, and the lowest - 0 in 2007. The data has a decreasing trend.
The average number of injuries per 1,000 fires is 19. This indicator was the highest - 82 in 2003, and the lowest 0 in 2007. The trend for casualties per 1,000 fire incidents is declining. Compared to the state value the number of injuries per 1,000 incidents is much higher.Casualties per 1,000 incidents in Cranford, NJ compared to nearest cities:
(Note: Based on data for all years, including only cities with at least 500 fire incidents)
| Cranford: | 19.9 |
| Westfield: | 9.8 |
| Roselle: | 28.9 |
| Clark: | 14.5 |
| Linden: | 11.6 |
| Springfield: | 6.7 |
| Union: | 26.2 |
| Rahway: | 8.9 |
| Scotch Plains: | 4.8 |
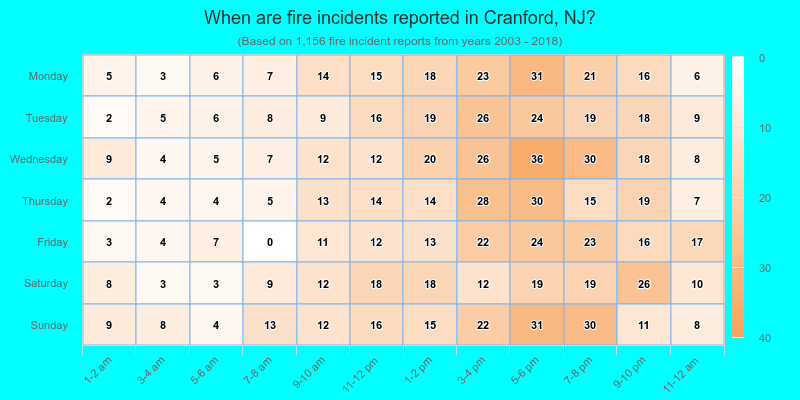
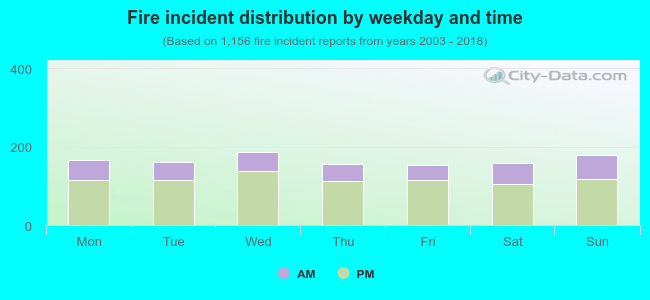 29.3% incidents where reported in the morning and 70.7% in the evening. The most fires (16.2%) took place on Wednesday, and the least (13.1%) on Friday.
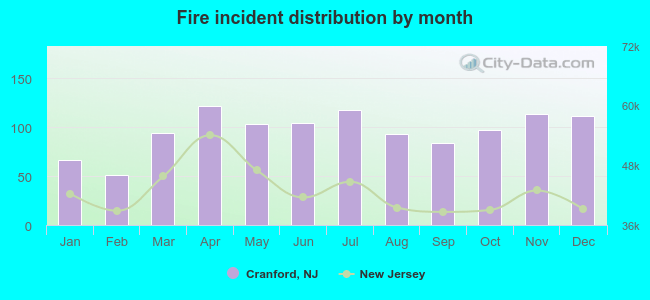 According to the 1,156 fires from years 2003 - 2018 most fires (10.6%) took place during April, and the least (4.4%) in February.
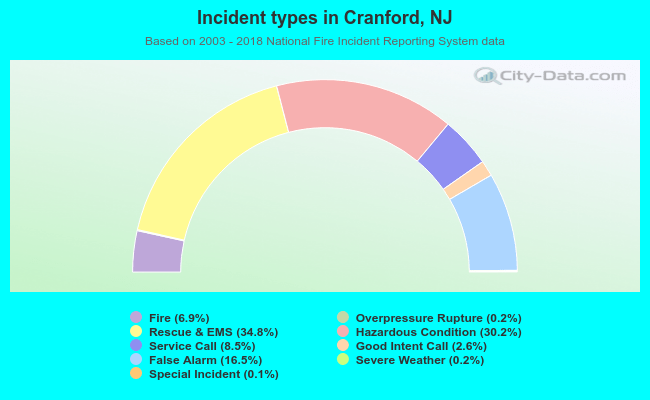 Out of all 16,722 cases reported during the years 2003 - 2018, the most belonged to the categories: Rescue & EMS (34.8%), Hazardous Condition (30.2%), and False Alarm (16.5%).
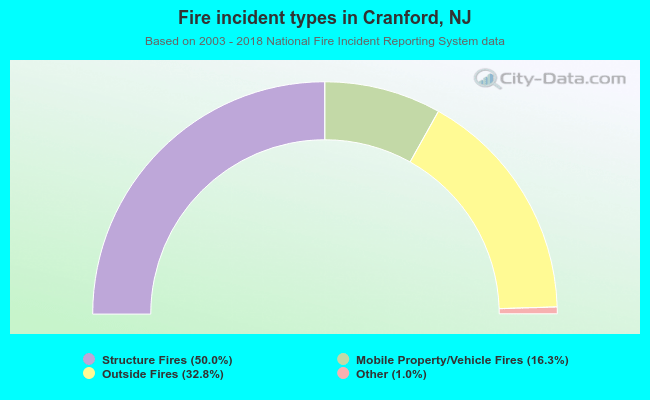 When looking into fire subcategories, the most reports belonged to: Structure Fires (50.0%), and Outside Fires (32.8%).