| Fire incidents reported |
|---|
| Sreet name | Count |
|---|
| US RT 2 | 8 | | WALDEN HILL ROAD | 8 | | 374 BRAINERD STREET | 6 | | ONEIDA RD | 6 | | US ROUTE 2 | 6 | | US ROUTE 2 WEST | 6 | | US RTE 2 | 6 | | WALDEN HILL RD | 6 | | 2724 JOES BROOK RD | 4 | | BRAINERD STREET | 4 | | HIGHLAND AVE | 4 | | NORTH DANVILLE RD | 4 | | ONEIDA ROAD | 4 | | PEACHAM RD | 4 | | PEACHAM ROAD | 4 | | RT 2 | 4 | | RT 2 LGTS | 4 | | US ROUTE 2 EAST | 4 | | US RT 2 E | 4 | | WALDEN HILL RD | 4 | | WINN HIGH DRIVE | 4 | | 1008 CALKINS CAMP RD | 2 | | 1076 ONEIDA RD | 2 | | 1111 CORMIER RD | 2 | | 1178 COUNTY ROAD | 2 |
| | | Fire incidents reported |
|---|
| Sreet name | Count |
|---|
| 1187 COUNTY HILL RD | 2 | | 1319 NORTH DANVILLE RD | 2 | | 1328 STANTON ROAD | 2 | | 1330 COLES POND RD | 2 | | 1450 BRUCE BADGER MEMORIAL HWY | 2 | | 1453 NORTH DANVILLE ROAD | 2 | | 1499 PEACHAM RD | 2 | | 1512 TRESTLE RD | 2 | | 155 BRAINERD STREET | 2 | | 180 MCREYNOLDS RD | 2 | | 1832 WALDEN HILL RD | 2 | | 1906 JOES BROOK ROAD | 2 | | 1994 TAMPICO RD | 2 | | 261 WEBSTER HILL ROAD | 2 | | 280 MCREYNOLDS RD | 2 | | 2916 JOES BROOK RD | 2 | | 300 HOUGHTON BRIDGE ROAD | 2 | | 310 CALKINS CAMP RD | 2 | | 326 ONEIDA RD | 2 | | 33 CEDAR LANE | 2 | | 358 HILL ST | 2 | | 450 CLARKS ROAD | 2 | | 511 LIBRARY ROAD | 2 | | 544 PUMPKIN HILL RD | 2 | | |
|
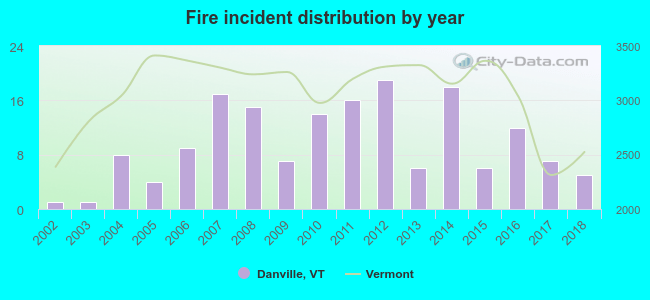 According to the data from the years 2002 - 2018 the average number of fire incidents per year is 10. The highest number of fire incidents - 19 took place in 2012, and the least - 1 in 2002. The data has a growing trend.
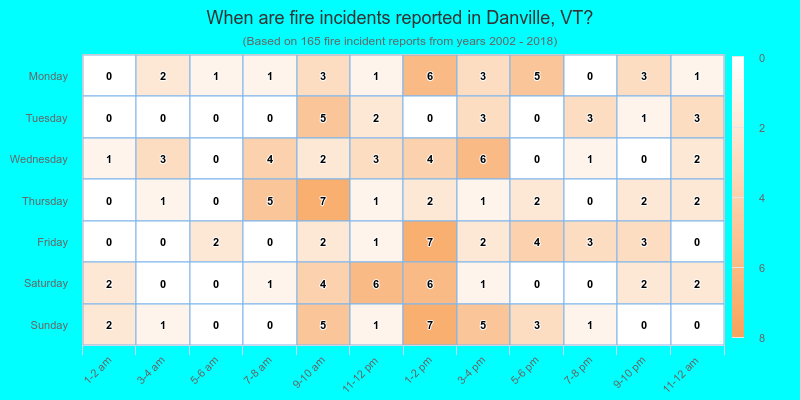
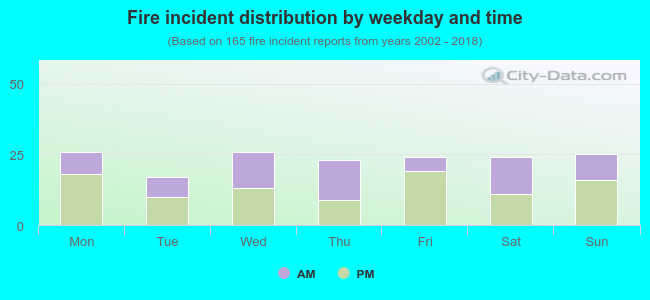 41.8% incidents where reported in the morning and 58.2% in the evening. The most fires (15.8%) took place on Monday, and the least (10.3%) on Tuesday.
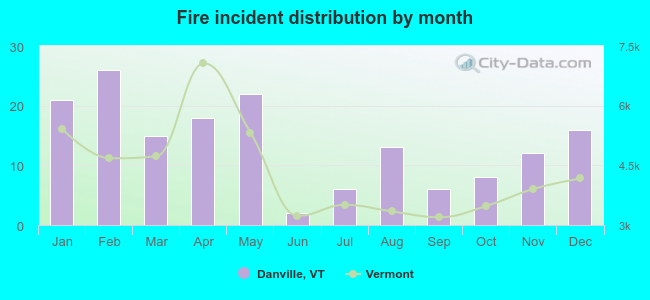 According to the 165 fire incidents from years 2002 - 2018 most fires (15.8%) took place during February, and the least (1.2%) in June.
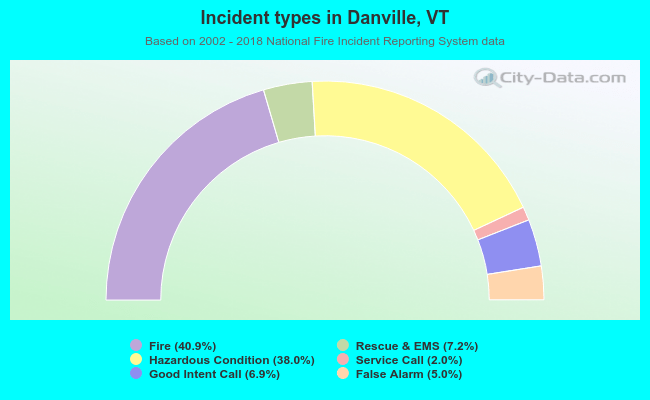 Out of all 403 cases reported during the years 2002 - 2018, the most belonged to the categories: Fire (40.9%), Rescue & EMS (38.0%), and Overpressure Rupture (7.2%).
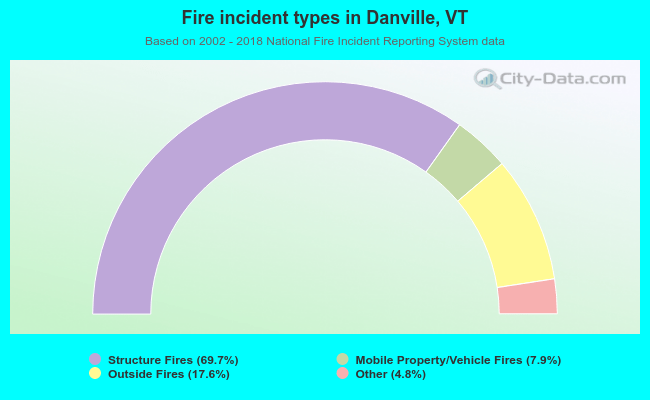 When looking into fire subcategories, the most reports belonged to: Structure Fires (69.7%), and Outside Fires (17.6%).