Dayton: Fire Incidents, New Jersey (NJ)
Where are fire incidents reported in Dayton, NJ
Something went wrong! Please refresh the page.
|
| |||||||||||||||||||||||||||||||||||||||||||||||||||||||||||||||||||||||||||||
2002 - 2018 National Fire Incident Reporting System (NFIRS) incidents
- Incident types reported to NFIRS in Dayton, NJ
- 36453.5%False Alarm
- 13720.1%Fire
- 13720.1%Hazardous Condition
- 202.9%Good Intent Call
- 121.8%Service Call
- 101.5%Rescue & EMS
- 10.1%Overpressure Rupture
- Fire incident types reported to NFIRS in Dayton, NJ
- 6547.4%Outside Fires
- 4129.9%Structure Fires
- 2719.7%Mobile Property/Vehicle Fires
- 42.9%Other
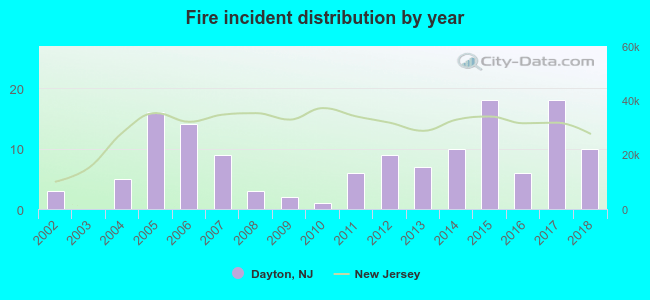 Based on the data from the years 2002 - 2018 the average number of fire incidents per year is 8. The highest number of fire incidents - 18 took place in 2015, and the least - 0 in 2003. The data has a rising trend.
The average number of yearly fire incidents per 10k residents in Dayton, NJ compared to nearest cities:
(Note: Based on data for the last 3 years, including only cities with population 5,000 and above)
| Dayton: | 16.0 |
| Kendall Park: | 7.1 |
| Jamesburg: | 16.6 |
| Milltown: | 17.5 |
| Spotswood: | 16.0 |
| East Brunswick: | 18.2 |
| Princeton: | 24.9 |
| Hightstown: | 74.8 |
| New Brunswick: | 21.3 |
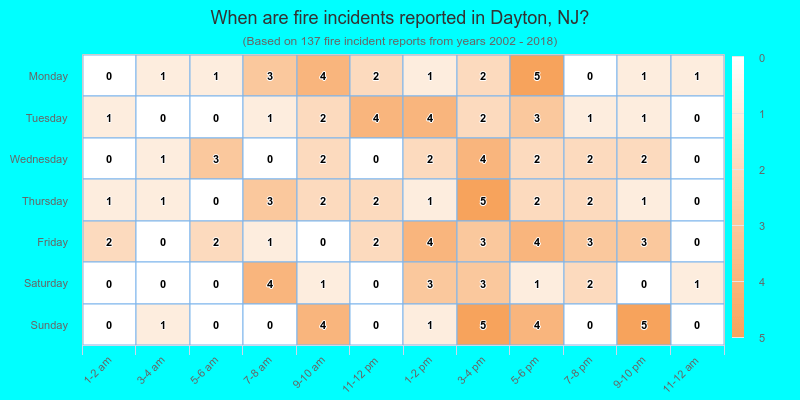
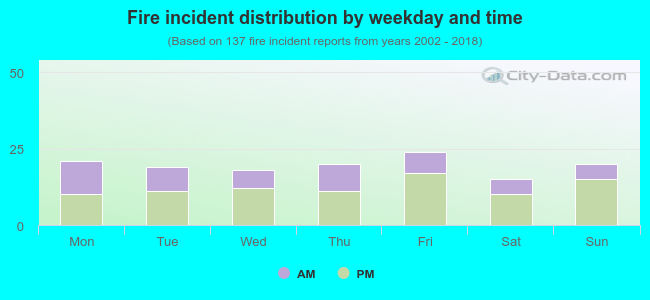 37.2% incidents where reported in the morning and 62.8% in the evening. The most fires (17.5%) took place on Friday, and the least (10.9%) on Saturday.
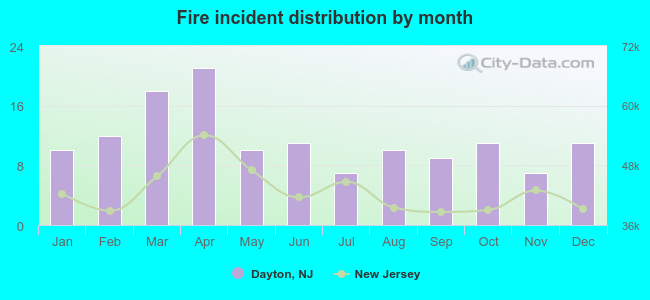 Based on the 137 fires from years 2002 - 2018 most fires (15.3%) took place during April, and the least (5.1%) in July.
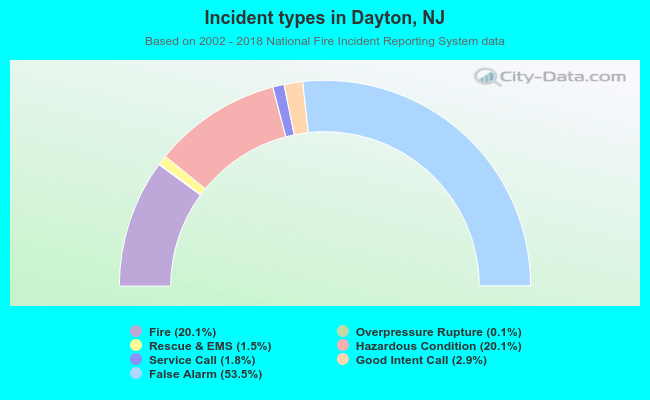 Out of all 681 cases reported during the years 2002 - 2018, the most belonged to the categories: False Alarm (53.5%), Fire (20.1%), and Hazardous Condition (20.1%).
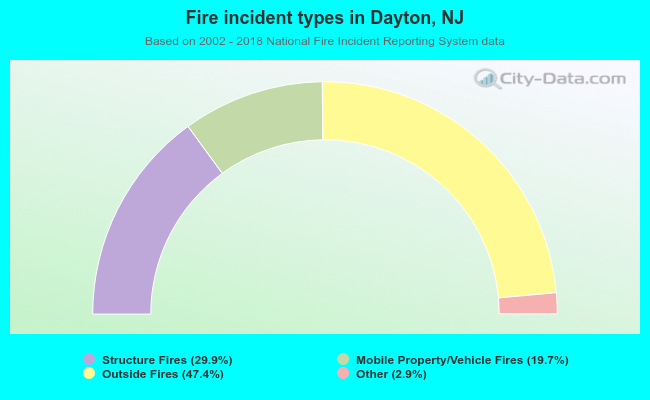 When looking into fire subcategories, the most reports belonged to: Outside Fires (47.4%), and Structure Fires (29.9%).