Dellwood: Fire Incidents, Missouri (MO)
Where are fire incidents reported in Dellwood, MO
Something went wrong! Please refresh the page.
|
| |||||||||||||||||||||||||||||||||||||||||||||||||||||||||||||||||||||||||||||||||||||||||||||||||||||||||||||
2002 - 2018 National Fire Incident Reporting System (NFIRS) incidents
- Incident types reported to NFIRS in Dellwood, MO
- 32542.6%Service Call
- 14719.3%Fire
- 7910.4%Hazardous Condition
- 7610.0%Rescue & EMS
- 688.9%Good Intent Call
- 668.7%False Alarm
- 20.3%Special Incident
- Fire incident types reported to NFIRS in Dellwood, MO
- 6846.3%Other
- 5537.4%Structure Fires
- 149.5%Outside Fires
- 106.8%Mobile Property/Vehicle Fires
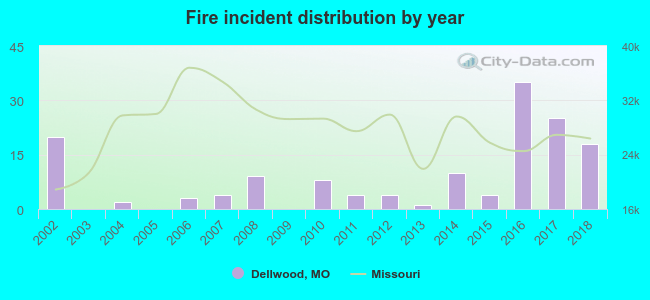 Based on the data from the years 2002 - 2018 the average number of fires per year is 9. The highest number of fires - 35 took place in 2016, and the least - 0 in 2003. The data has a declining trend.
The average number of yearly fire incidents per 10k residents in Dellwood, MO compared to nearest cities:
(Note: Based on data for the last 3 years, including only cities with population 5,000 and above)
| Dellwood: | 51.9 |
| Ferguson: | 75.6 |
| Black Jack: | 7.2 |
| Jennings: | 83.5 |
| Berkeley: | 76.3 |
| Spanish Lake: | 8.7 |
| Florissant: | 45.0 |
| Glasgow Village: | 7.4 |
| Hazelwood: | 29.2 |
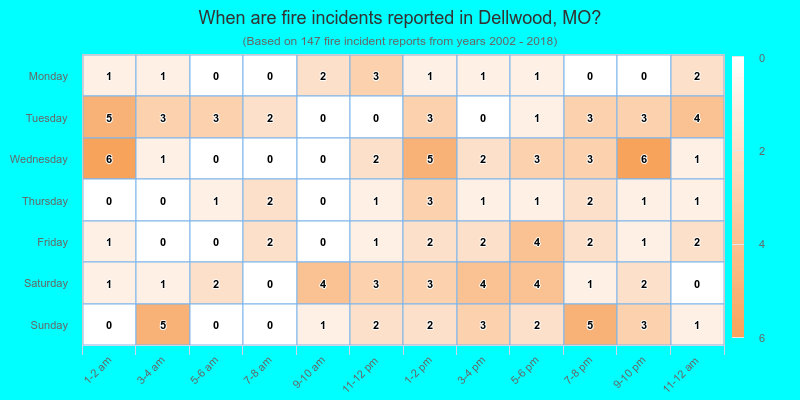
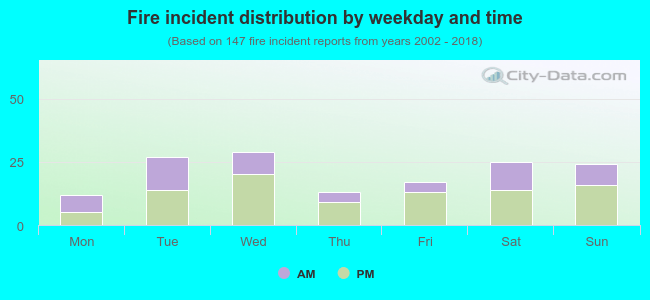 38.1% incidents where reported in the morning and 61.9% in the evening. The most fires (19.7%) took place on Wednesday, and the least (8.2%) on Monday.
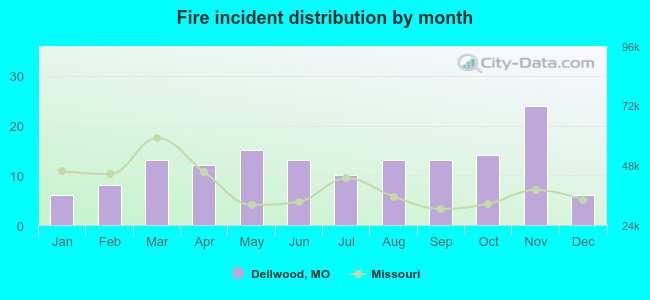 Based on the 147 fire incident reports from years 2002 - 2018 most fires (16.3%) took place during November, and the least (4.1%) in January.
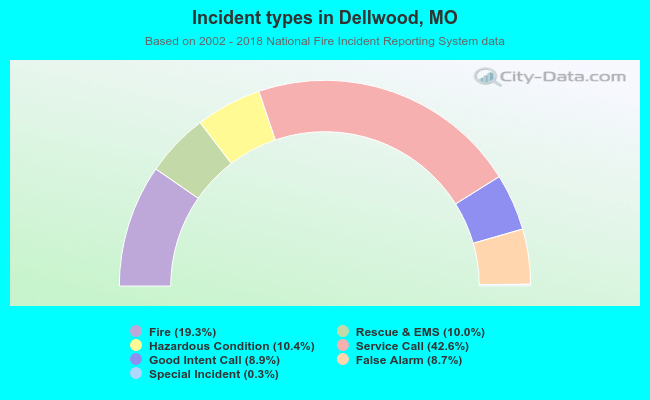 Out of all 763 cases reported during the years 2002 - 2018, the most belonged to the categories: Hazardous Condition (42.6%), Fire (19.3%), and Rescue & EMS (10.4%).
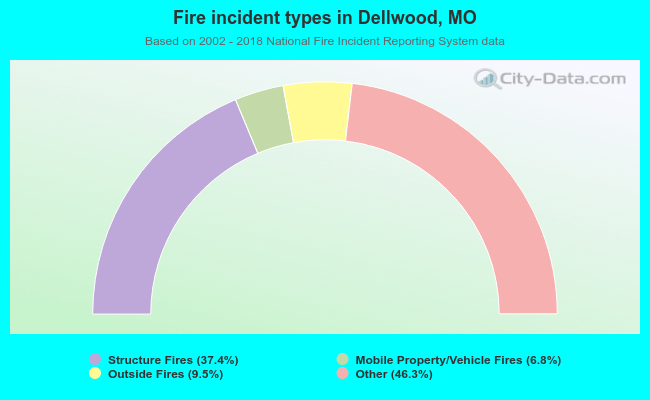 When looking into fire subcategories, the most reports belonged to: Other (46.3%), and Structure Fires (37.4%).