Delta: Fire Incidents, Colorado (CO)
Where are fire incidents reported in Delta, CO
Something went wrong! Please refresh the page.
|
| |||||||||||||||||||||||||||||||||||||||||||||||||||||||||||||||||||||||||||||||||||||||||||||||||||||||||||||
2006 - 2018 National Fire Incident Reporting System (NFIRS) incidents
- Incident types reported to NFIRS in Delta, CO
- 54834.1%Hazardous Condition
- 45728.4%Fire
- 34821.6%Good Intent Call
- 1086.7%Service Call
- 794.9%Rescue & EMS
- 523.2%False Alarm
- 110.7%Overpressure Rupture
- 40.2%Severe Weather
- Fire incident types reported to NFIRS in Delta, CO
- 29965.4%Outside Fires
- 8518.6%Structure Fires
- 5912.9%Mobile Property/Vehicle Fires
- 143.1%Other
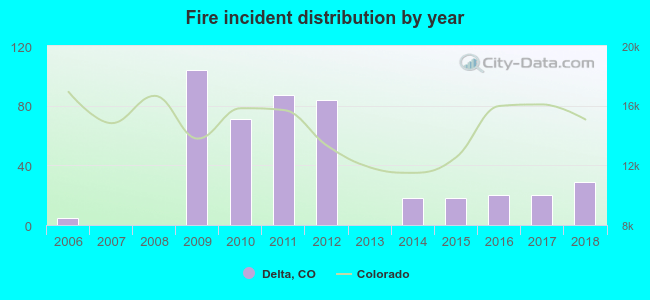 According to the data from the years 2006 - 2018 the average number of fire incidents per year is 35. The highest number of reported fires - 104 took place in 2009, and the least - 0 in 2007. The data has a rising trend.
The average number of yearly fire incidents per 10k residents in Delta, CO compared to nearest cities:
(Note: Based on data for the last 3 years, including only cities with population 5,000 and above)
| Delta: | 26.4 |
| Montrose: | 83.0 |
| Clifton: | 26.1 |
| Grand Junction: | 49.1 |
| Fruita: | 55.4 |
| Grand Valley: | 1.6 |
| Rifle: | 44.3 |
| Gunnison: | 17.9 |
| Carbondale: | 44.6 |

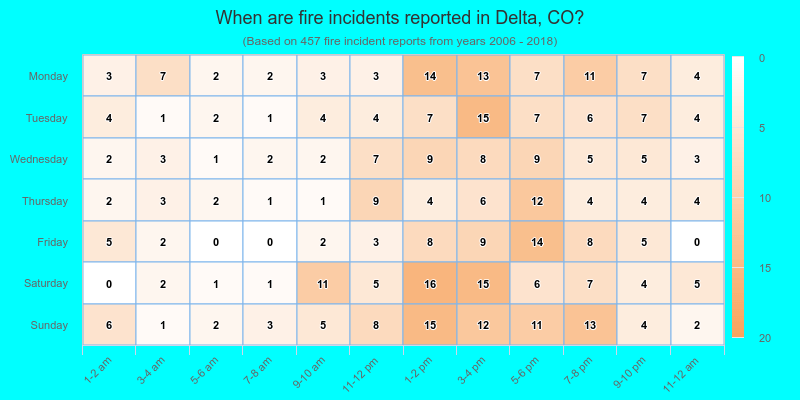
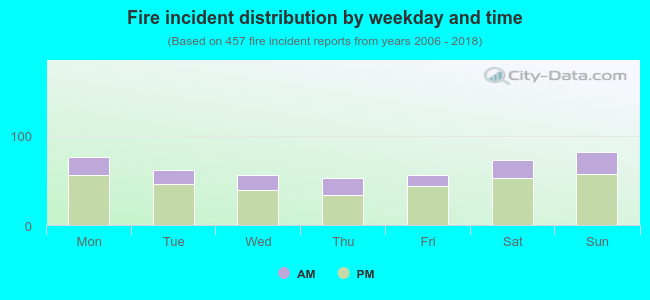 28.0% incidents where reported in the morning and 72.0% in the evening. The most fires (17.9%) took place on Sunday, and the least (11.4%) on Thursday.
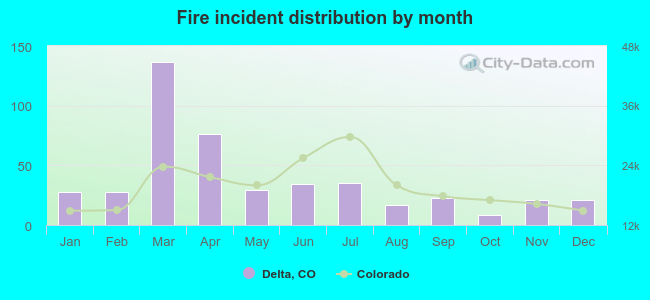 Based on the 457 fire incident reports from years 2006 - 2018 most fires (30.0%) took place during March, and the least (1.8%) in October.
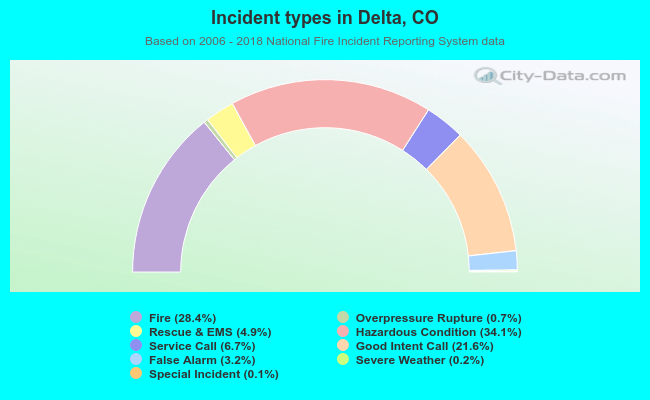 Out of all 1,608 cases reported during the years 2006 - 2018, the most belonged to the categories: Hazardous Condition (34.1%), Fire (28.4%), and Good Intent Call (21.6%).
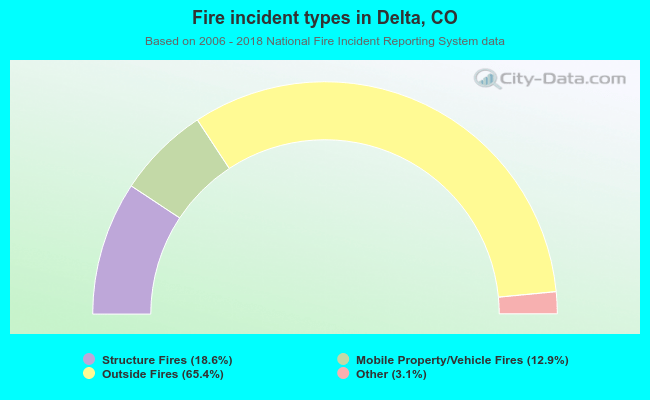 When looking into fire subcategories, the most reports belonged to: Outside Fires (65.4%), and Structure Fires (18.6%).