Denair: Fire Incidents, California (CA)
Where are fire incidents reported in Denair, CA
Something went wrong! Please refresh the page.
|
| |||||||||||||||||||||||||||||||||||||||||||||||||||||||||||||||||||||||||||||||||||||||||||||||||||||||||||||
2004 - 2017 National Fire Incident Reporting System (NFIRS) incidents
- Incident types reported to NFIRS in Denair, CA
- 14244.8%Fire
- 10834.1%Rescue & EMS
- 288.8%Hazardous Condition
- 154.7%Service Call
- 144.4%False Alarm
- 103.2%Good Intent Call
- Fire incident types reported to NFIRS in Denair, CA
- 8660.6%Outside Fires
- 2618.3%Mobile Property/Vehicle Fires
- 2316.2%Structure Fires
- 74.9%Other
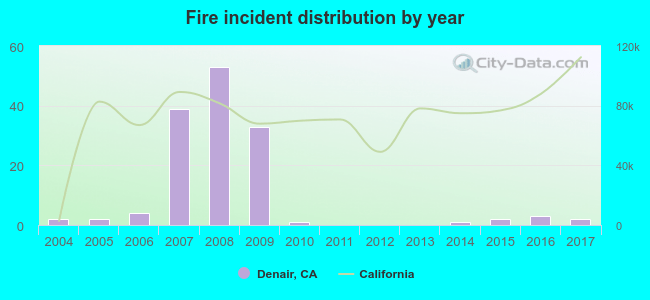 Based on the data from the years 2004 - 2017 the average number of fires per year is 10. The highest number of reported fire incidents - 53 took place in 2008, and the least - 0 in 2011. The data has a constant trend.
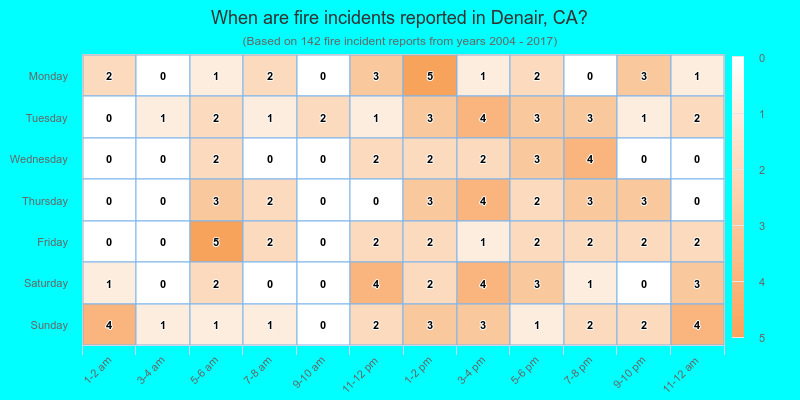
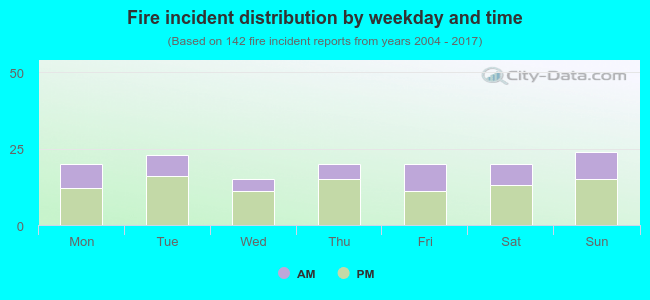 34.5% incidents where reported in the morning and 65.5% in the evening. The most fires (16.9%) took place on Sunday, and the least (10.6%) on Wednesday.
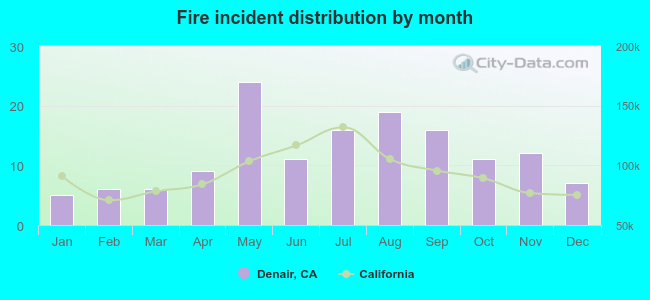 Based on the 142 fires from years 2004 - 2017 most fires (16.9%) took place during May, and the least (3.5%) in January.
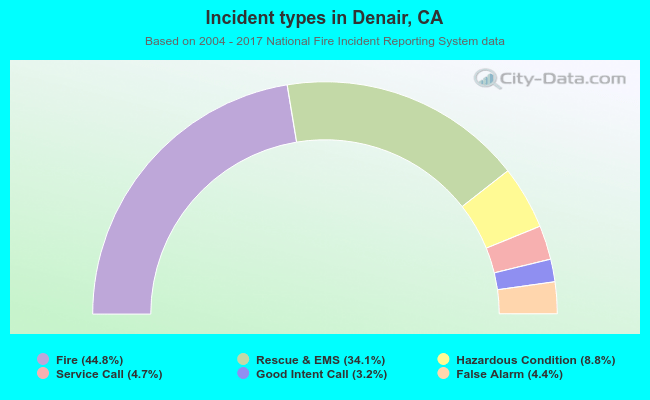 Out of all 317 cases reported during the years 2004 - 2017, the most belonged to the categories: Fire (44.8%), Overpressure Rupture (34.1%), and Rescue & EMS (8.8%).
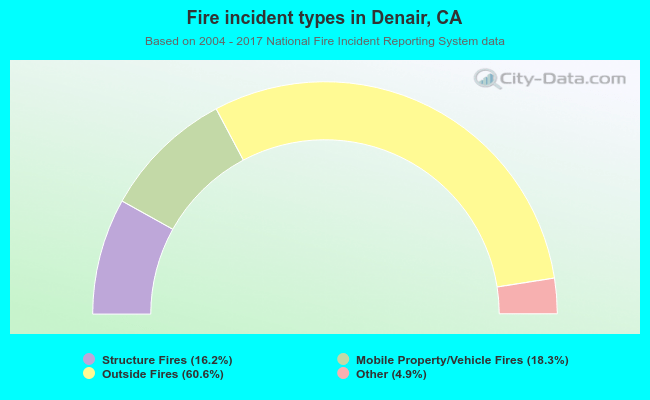 When looking into fire subcategories, the most reports belonged to: Outside Fires (60.6%), and Mobile Property/Vehicle Fires (18.3%).