Dunwoody: Fire Incidents, Georgia (GA)
Where are fire incidents reported in Dunwoody, GA
Something went wrong! Please refresh the page.
|
| |||||||||||||||||||||||||||||||||||||||||||||||||||||||||||||||||||||||||||||||||||||||||||||||||||||||||||||
2003 - 2018 National Fire Incident Reporting System (NFIRS) incidents
- Incident types reported to NFIRS in Dunwoody, GA
- 5,01251.4%Rescue & EMS
- 1,33113.6%False Alarm
- 1,07811.0%Good Intent Call
- 99210.2%Service Call
- 8378.6%Hazardous Condition
- 4624.7%Fire
- 170.2%Overpressure Rupture
- 160.2%Severe Weather
- 150.2%Special Incident
- Fire incident types reported to NFIRS in Dunwoody, GA
- 17537.9%Outside Fires
- 17437.7%Structure Fires
- 10021.6%Mobile Property/Vehicle Fires
- 132.8%Other
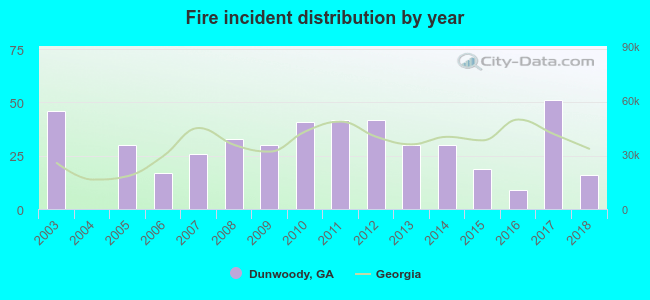 According to the data from the years 2003 - 2018 the average number of fires per year is 29. The highest number of fires - 51 took place in 2017, and the least - 0 in 2004. The data has a decreasing trend.
The average number of yearly fire incidents per 10k residents in Dunwoody, GA compared to nearest cities:
(Note: Based on data for the last 3 years, including only cities with population 5,000 and above)
| Dunwoody: | 5.3 |
| Sandy Springs: | 20.1 |
| Doraville: | 21.8 |
| Chamblee: | 34.8 |
| Norcross: | 137.6 |
| Roswell: | 18.7 |
| Tucker: | 29.4 |
| Johns Creek: | 8.3 |
| Alpharetta: | 29.3 |
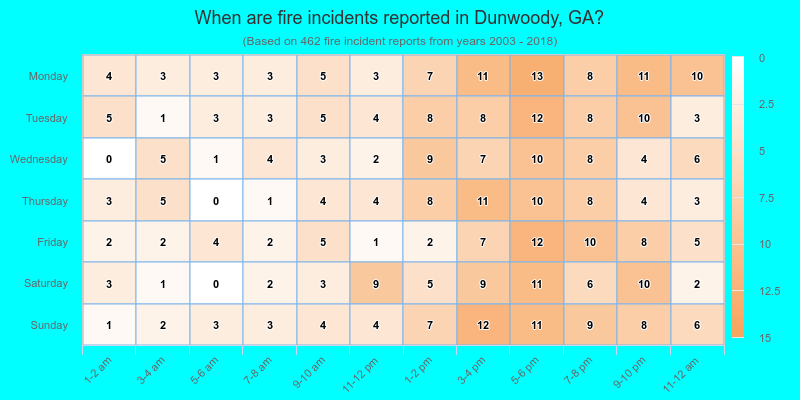
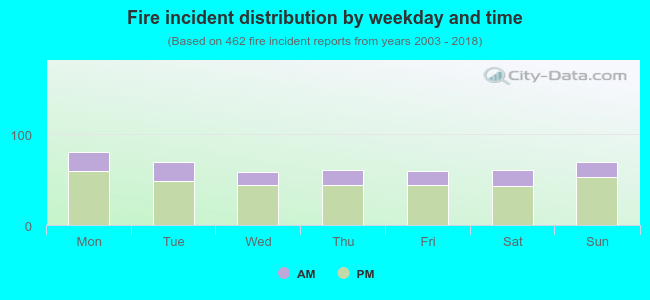 27.1% incidents where reported in the morning and 72.9% in the evening. The most fires (17.5%) took place on Monday, and the least (12.8%) on Wednesday.
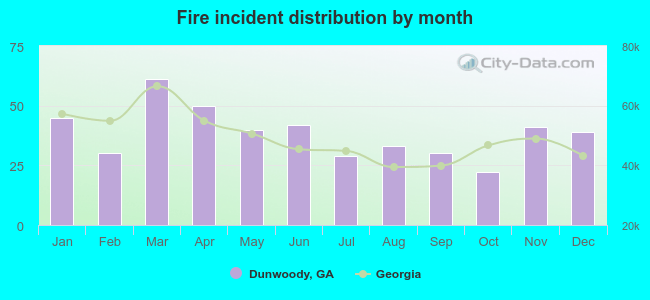 Based on the 462 reports from years 2003 - 2018 most fires (13.2%) took place during March, and the least (4.8%) in October.
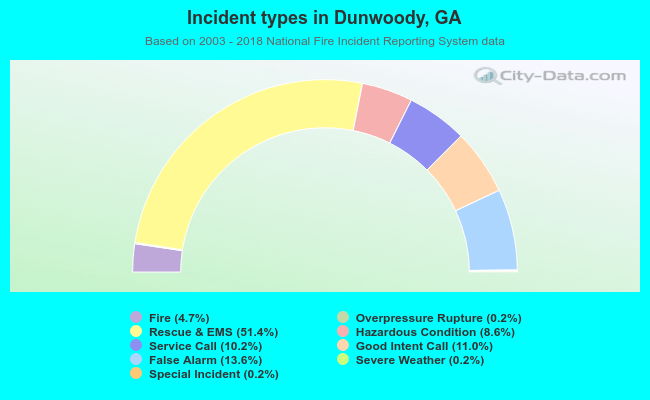 Out of all 9,760 cases reported during the years 2003 - 2018, the most belonged to the categories: Rescue & EMS (51.4%), False Alarm (13.6%), and Good Intent Call (11.0%).
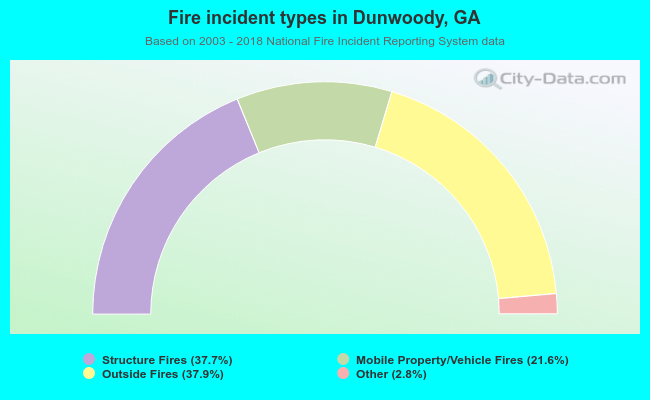 When looking into fire subcategories, the most incidents belonged to: Outside Fires (37.9%), and Structure Fires (37.7%).