East Greenbush: Fire Incidents, New York (NY)
Where are fire incidents reported in East Greenbush, NY
Something went wrong! Please refresh the page.
|
| |||||||||||||||||||||||||||||||||||||||||||||||||||||||||||||||||||||||||||||||||||||||||||||||||||||||||||||
2002 - 2018 National Fire Incident Reporting System (NFIRS) incidents
- Incident types reported to NFIRS in East Greenbush, NY
- 74327.1%Hazardous Condition
- 53019.3%Rescue & EMS
- 49618.1%False Alarm
- 43615.9%Fire
- 32111.7%Good Intent Call
- 1806.6%Service Call
- 240.9%Severe Weather
- 70.3%Overpressure Rupture
- 30.1%Special Incident
- Fire incident types reported to NFIRS in East Greenbush, NY
- 21549.3%Structure Fires
- 12228.0%Outside Fires
- 8619.7%Mobile Property/Vehicle Fires
- 133.0%Other
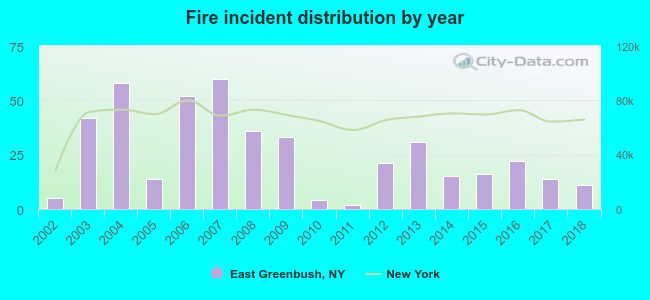 According to the data from the years 2002 - 2018 the average number of fires per year is 26. The highest number of reported fires - 60 took place in 2007, and the least - 2 in 2011. The data has a rising trend.
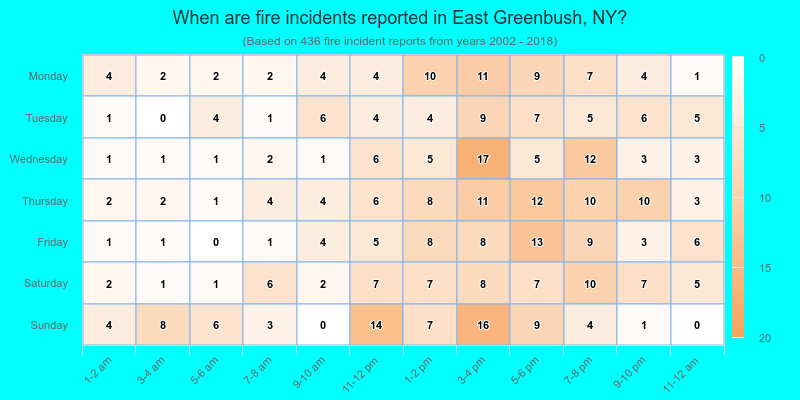
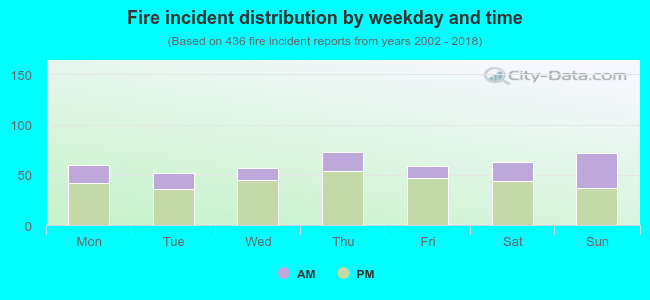 30.0% incidents where reported in the morning and 70.0% in the evening. The most fires (16.7%) took place on Thursday, and the least (11.9%) on Tuesday.
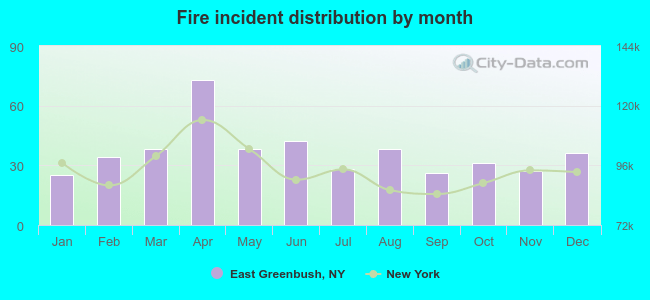 According to the 436 incident reports from years 2002 - 2018 most fires (16.7%) took place during April, and the least (5.7%) in January.
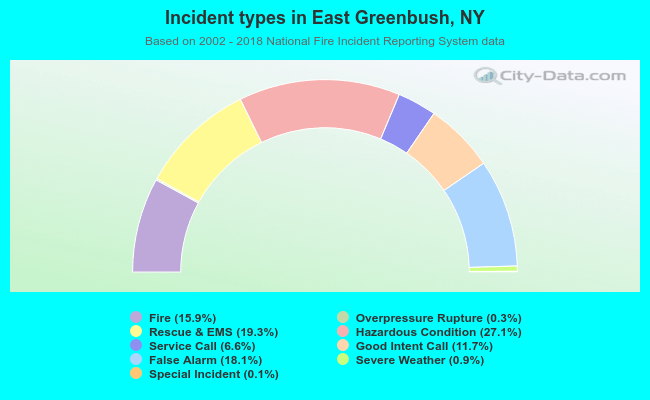 Out of all 2,740 cases reported during the years 2002 - 2018, the most belonged to the categories: Hazardous Condition (27.1%), Rescue & EMS (19.3%), and False Alarm (18.1%).
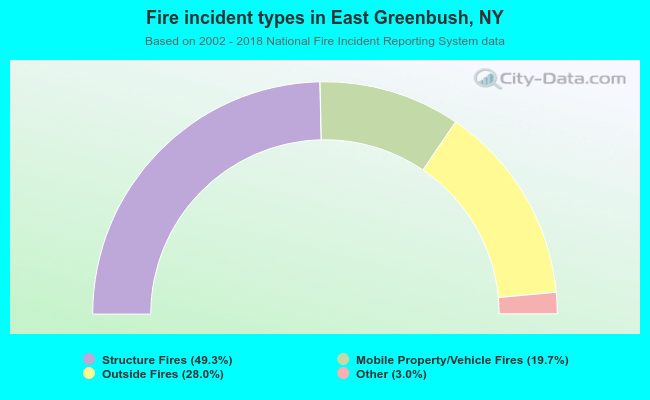 When looking into fire subcategories, the most incidents belonged to: Structure Fires (49.3%), and Outside Fires (28.0%).