East Northport: Fire Incidents, New York (NY)
Where are fire incidents reported in East Northport, NY
Something went wrong! Please refresh the page.
|
| |||||||||||||||||||||||||||||||||||||||||||||||||||||||||||||||||||||||||||||||||||||||||||||||||||||||||||||
2003 - 2018 National Fire Incident Reporting System (NFIRS) incidents
- Incident types reported to NFIRS in East Northport, NY
- 6,01069.6%Rescue & EMS
- 87910.2%Hazardous Condition
- 7318.5%False Alarm
- 3884.5%Good Intent Call
- 3874.5%Fire
- 2222.6%Service Call
- 110.1%Severe Weather
- Fire incident types reported to NFIRS in East Northport, NY
- 15439.8%Outside Fires
- 14236.7%Structure Fires
- 5815.0%Mobile Property/Vehicle Fires
- 338.5%Other
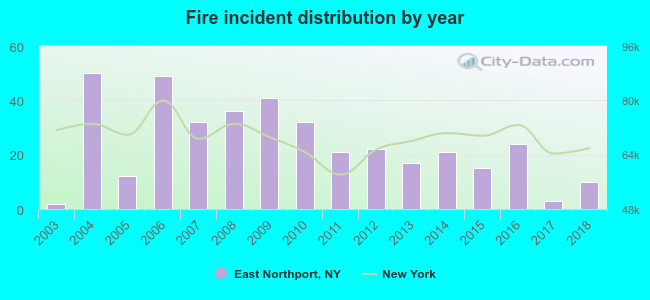 According to the data from the years 2003 - 2018 the average number of fire incidents per year is 24. The highest number of reported fires - 50 took place in 2004, and the least - 2 in 2003. The data has a growing trend.
The average number of yearly fire incidents per 10k residents in East Northport, NY compared to nearest cities:
(Note: Based on data for the last 3 years, including only cities with population 5,000 and above)
| East Northport: | 6.1 |
| Northport: | 32.8 |
| Greenlawn: | 5.1 |
| Centerport: | 1.8 |
| Commack: | 5.4 |
| Kings Park: | 10.6 |
| Huntington: | 8.7 |
| Huntington Station: | 17.0 |
| Dix Hills: | 2.2 |
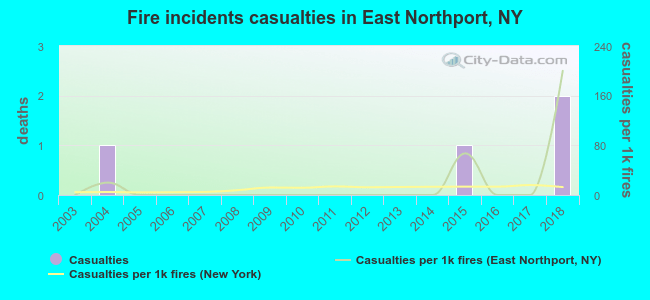 According to the reports from the years 2003 - 2018 the average number of fire-related casualties per year is 0. The highest number of injuries - 2 took place in 2018, and the lowest - 0 in 2003. The data has a growing trend.
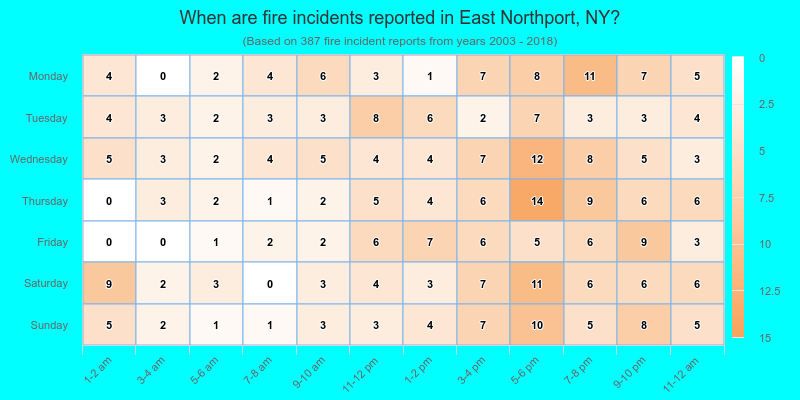
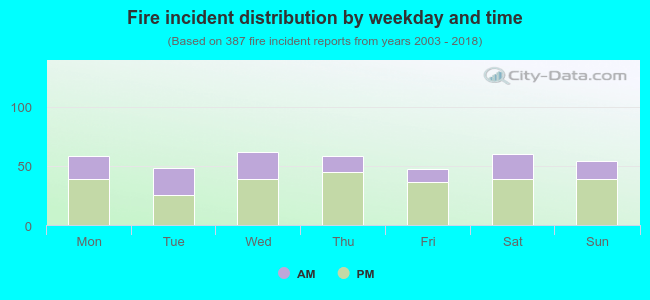 32.3% incidents where reported in the morning and 67.7% in the evening. The most fires (16.0%) took place on Wednesday, and the least (12.1%) on Friday.
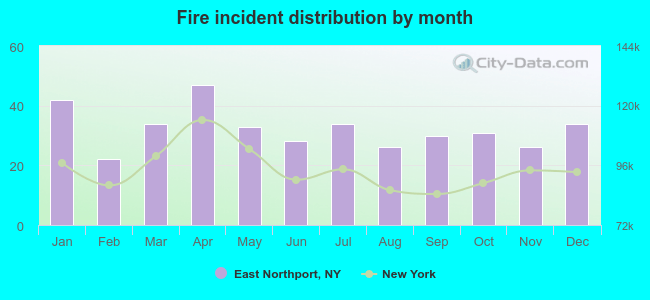 According to the 387 reports from years 2003 - 2018 most fires (12.1%) took place during April, and the least (5.7%) in February.
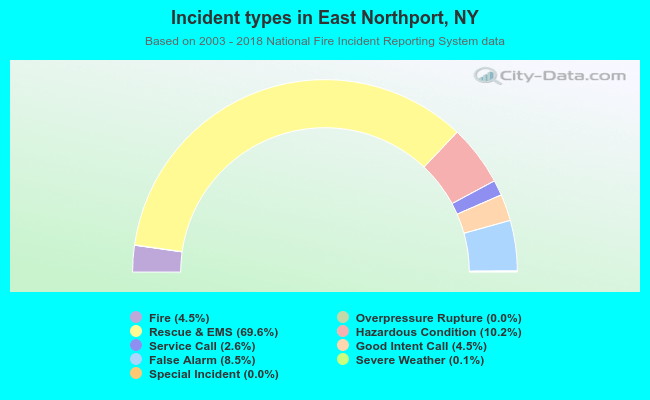 Out of all 8,633 cases reported during the years 2003 - 2018, the most belonged to the categories: Rescue & EMS (69.6%), Hazardous Condition (10.2%), and False Alarm (8.5%).
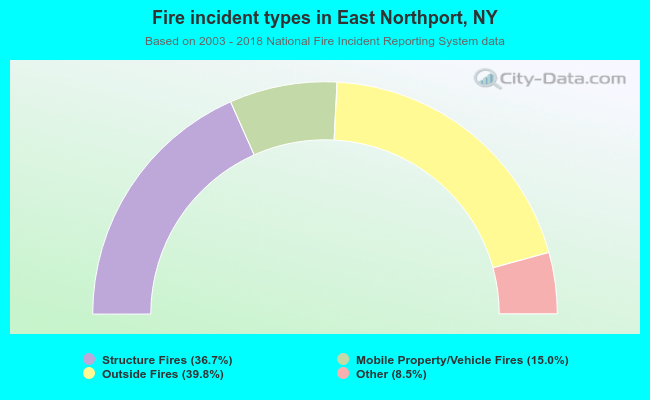 When looking into fire subcategories, the most incidents belonged to: Outside Fires (39.8%), and Structure Fires (36.7%).