Edmond: Fire Incidents, Oklahoma (OK)
Where are fire incidents reported in Edmond, OK
Something went wrong! Please refresh the page.
| Fire incidents reported | |
|---|---|
| Sreet name | Count |
| 15TH ST | 454 |
| 2ND ST | 406 |
| BROADWAY | 344 |
| WATERLOO RD | 322 |
| DANFORTH RD | 294 |
| COVELL RD | 258 |
| 33RD ST | 212 |
| KELLY AVE | 176 |
| BRYANT AVE | 168 |
| SORGHUM MILL RD | 142 |
| WATERLOO | 142 |
| BOULEVARD | 128 |
| 206TH ST | 126 |
| 234TH ST | 124 |
| COFFEE CREEK RD | 118 |
| WESTERN AVE | 114 |
| 220TH ST | 106 |
| 178TH ST | 104 |
| SANTA FE AVE | 102 |
| MERIDIAN AVE | 96 |
| KICKINGBIRD RD | 86 |
| MAY AVE | 84 |
| CHARTER OAK | 78 |
| COLTRANE RD | 78 |
| SOONER RD | 78 |
| FRETZ AVE | 76 |
| SIMMONS RD | 74 |
| 192ND ST | 72 |
| MACARTHUR BLVD | 70 |
| I-35 | 68 |
| Other | 1,941 |
2002 - 2018 National Fire Incident Reporting System (NFIRS) incidents
- Incident types reported to NFIRS in Edmond, OK
- 30,75853.8%Rescue & EMS
- 7,88413.8%Good Intent Call
- 6,64111.6%Fire
- 4,6718.2%Service Call
- 3,7856.6%False Alarm
- 3,2035.6%Hazardous Condition
- 1090.2%Overpressure Rupture
- 580.1%Severe Weather
- Fire incident types reported to NFIRS in Edmond, OK
- 3,79457.1%Outside Fires
- 1,82627.5%Structure Fires
- 74011.1%Mobile Property/Vehicle Fires
- 2814.2%Other
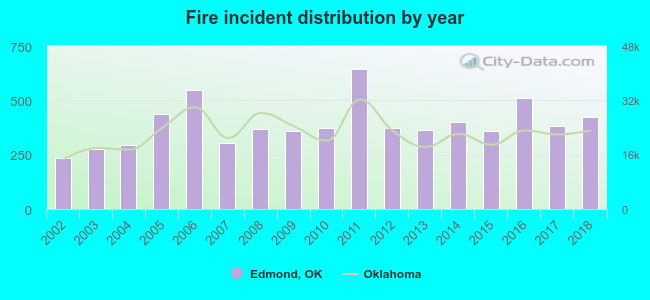 According to the data from the years 2002 - 2018 the average number of fire incidents per year is 391. The highest number of reported fire incidents - 642 took place in 2011, and the least - 233 in 2002. The data has a rising trend.
The average number of yearly fire incidents per 10k residents in Edmond, OK compared to nearest cities:
(Note: Based on data for the last 3 years, including only cities with population 5,000 and above)
| Edmond: | 49.5 |
| The Village: | 24.7 |
| Warr Acres: | 38.4 |
| Oklahoma City: | 37.3 |
| Guthrie: | 219.0 |
| Midwest City: | 30.6 |
| Bethany: | 32.2 |
| Del City: | 42.6 |
| Piedmont: | 58.9 |
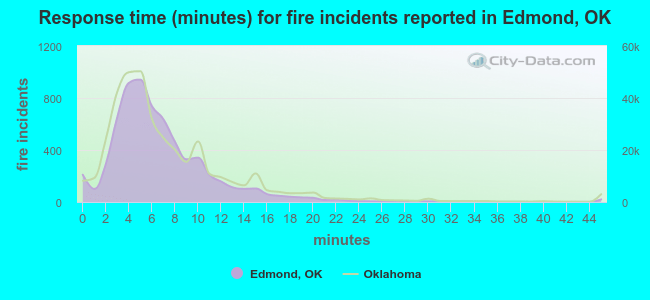 The median response time based on all reported fire incidents is 6 minutes. This is comparable to the Oklahoma median value.
The median response time in Edmond, OK compared to nearest cities:
(Note: Based on data for all years, including only cities with at least 500 fire incidents)
| Edmond: | 6 minutes |
| The Village: | 3 minutes |
| Spencer: | 4 minutes |
| Jones: | 8 minutes |
| Warr Acres: | 3 minutes |
| Oklahoma City: | 5 minutes |
| Guthrie: | 8 minutes |
| Midwest City: | 5 minutes |
| Bethany: | 4 minutes |
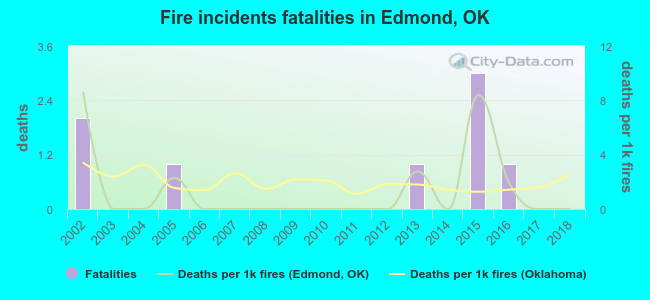 Based on the data from the years 2002 - 2018 the average number of fire-related fatalities per year is 0. The highest number of reported deaths - 3 took place in 2015, and the lowest - 0 in 2003. The data has a declining trend.
The average number of fatalities per 1,000 fires is 1. This indicator was the highest - 9 in 2002, and the lowest 0 in 2003. The trend for fatalities per 1,000 fire incidents is declining. Compared to the Oklahoma value the number of deaths per 1,000 fires is lower.
Based on the data from the years 2002 - 2018 the average number of fire-related fatalities per year is 0. The highest number of reported deaths - 3 took place in 2015, and the lowest - 0 in 2003. The data has a declining trend.
The average number of fatalities per 1,000 fires is 1. This indicator was the highest - 9 in 2002, and the lowest 0 in 2003. The trend for fatalities per 1,000 fire incidents is declining. Compared to the Oklahoma value the number of deaths per 1,000 fires is lower.Deaths per 1,000 incidents in Edmond, OK compared to nearest cities:
(Note: Based on data for all years, including only cities with at least 2,500 fire incidents)
| Edmond: | 1.2 |
| Oklahoma City: | 3.1 |
| Guthrie: | 1.8 |
| Midwest City: | 4.7 |
| Moore: | 1.1 |
| Norman: | 3.8 |
| Shawnee: | 0.4 |
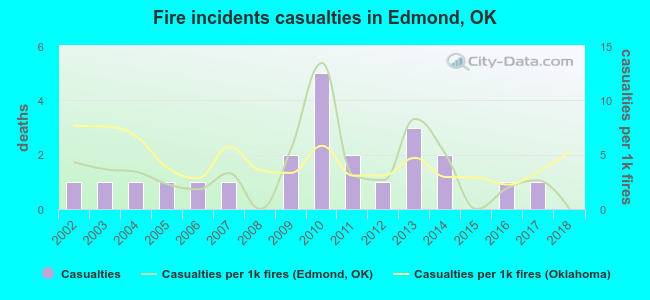 Based on the reports from the years 2002 - 2018 the average number of fire-related casualties per year is 1. The highest number of reported casualties - 5 took place in 2010, and the lowest - 0 in 2008. The data has a declining trend.
The average number of casualties per 1,000 fires is 4. This indicator was the highest - 13 in 2010, and the lowest 0 in 2008. The trend for casualties per 1,000 incidents is dropping. Compared to the state value the number of injuries per 1,000 fire incidents is lower.
Based on the reports from the years 2002 - 2018 the average number of fire-related casualties per year is 1. The highest number of reported casualties - 5 took place in 2010, and the lowest - 0 in 2008. The data has a declining trend.
The average number of casualties per 1,000 fires is 4. This indicator was the highest - 13 in 2010, and the lowest 0 in 2008. The trend for casualties per 1,000 incidents is dropping. Compared to the state value the number of injuries per 1,000 fire incidents is lower.Casualties per 1,000 incidents in Edmond, OK compared to nearest cities:
(Note: Based on data for all years, including only cities with at least 500 fire incidents)
| Edmond: | 3.5 |
| The Village: | 3.4 |
| Spencer: | 0.8 |
| Jones: | 0.0 |
| Warr Acres: | 1.4 |
| Oklahoma City: | 10.7 |
| Guthrie: | 1.1 |
| Midwest City: | 19.4 |
| Bethany: | 1.6 |
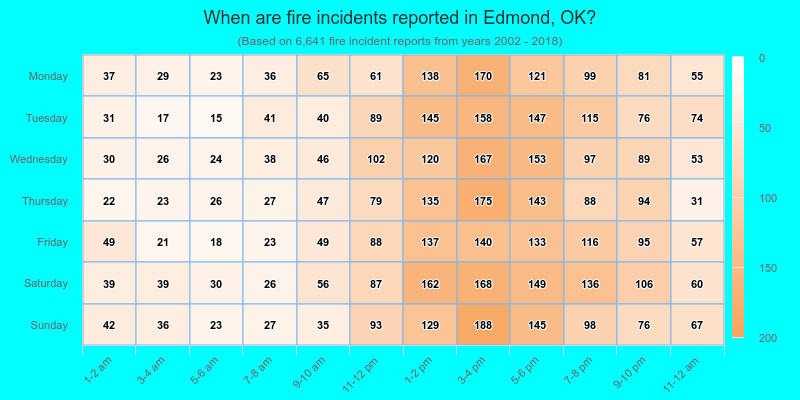
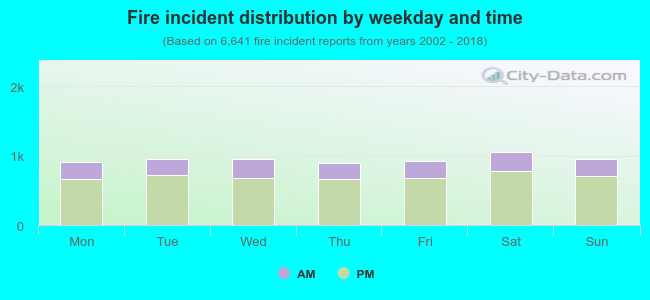 26.4% incidents where reported in the morning and 73.6% in the evening. The most fires (15.9%) took place on Saturday, and the least (13.4%) on Thursday.
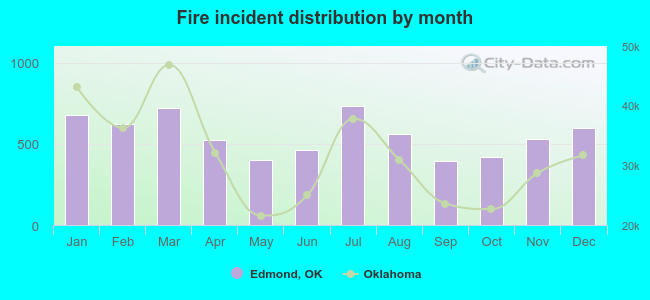 Based on the 6,641 fire incidents from years 2002 - 2018 most fires (11.1%) took place during July, and the least (5.9%) in September.
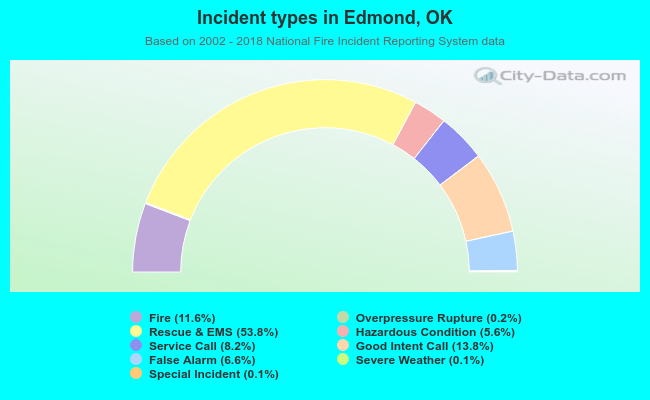 Out of all 57,163 cases reported during the years 2002 - 2018, the most belonged to the categories: Rescue & EMS (53.8%), Good Intent Call (13.8%), and Fire (11.6%).
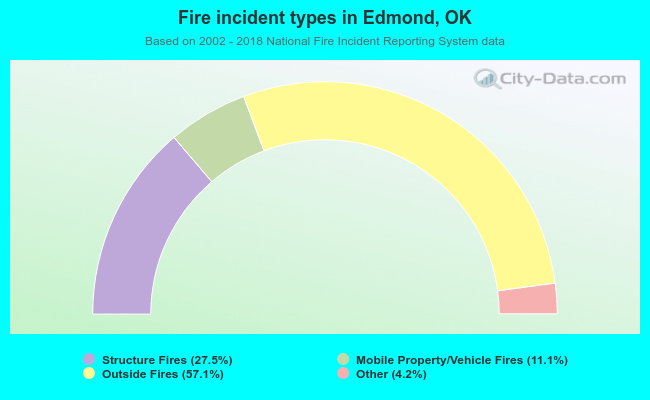 When looking into fire subcategories, the most incidents belonged to: Outside Fires (57.1%), and Structure Fires (27.5%).