Elizabethtown: Fire Incidents, Kentucky (KY)
Where are fire incidents reported in Elizabethtown, KY
Something went wrong! Please refresh the page.
| Fire incidents reported | |
|---|---|
| Sreet name | Count |
| DIXIE AVE | 280 |
| DIXIE | 130 |
| DIXIE HWY | 122 |
| MULBERRY ST | 100 |
| RING RD | 88 |
| I65 | 64 |
| I-65 | 58 |
| BLACK BRANCH RD | 50 |
| WOODLAND DR | 50 |
| INTERSTATE 65 | 48 |
| MAIN ST | 44 |
| BLUEGRASS PKY | 36 |
| BARDSTOWN RD | 34 |
| MILES ST | 32 |
| POPLAR ST | 32 |
| HAWKINS DR | 28 |
| LEITCHFIELD RD | 28 |
| RING | 28 |
| SYCAMORE ST | 28 |
| WESTPORT RD | 28 |
| BATTLE TRAINING RD | 24 |
| BLACKBRANCH RD | 24 |
| COMMERCE DR | 22 |
| HODGENVILLE RD | 22 |
| MILES | 22 |
| TOWNE DR | 22 |
| BELLWOOD DR | 20 |
| VALLEY CREEK RD | 20 |
| DOLPHIN DR | 18 |
| PEAR ORCHARD RD | 18 |
| Other | 796 |
2002 - 2018 National Fire Incident Reporting System (NFIRS) incidents
- Incident types reported to NFIRS in Elizabethtown, KY
- 3,27830.9%Rescue & EMS
- 2,31621.8%Fire
- 1,95418.4%False Alarm
- 1,63315.4%Hazardous Condition
- 9889.3%Good Intent Call
- 3343.1%Service Call
- 520.5%Severe Weather
- 400.4%Overpressure Rupture
- 220.2%Special Incident
- Fire incident types reported to NFIRS in Elizabethtown, KY
- 82535.6%Outside Fires
- 77433.4%Structure Fires
- 59025.5%Mobile Property/Vehicle Fires
- 1275.5%Other
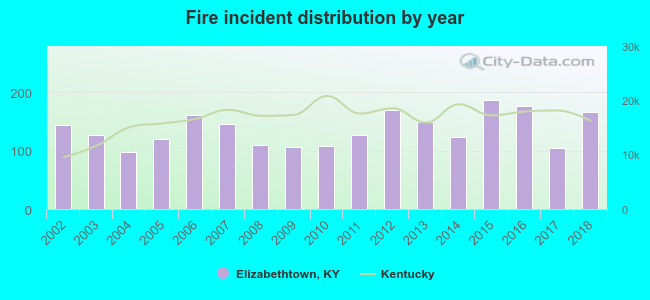 According to the data from the years 2002 - 2018 the average number of fire incidents per year is 136. The highest number of fires - 186 took place in 2015, and the least - 97 in 2004. The data has a growing trend.
The average number of yearly fire incidents per 10k residents in Elizabethtown, KY compared to nearest cities:
(Note: Based on data for the last 3 years, including only cities with population 5,000 and above)
| Elizabethtown: | 49.7 |
| Vine Grove: | 62.3 |
| Radcliff: | 25.6 |
| Shepherdsville: | 177.7 |
| Bardstown: | 41.5 |
| Coxs Creek: | 7.1 |
| Hillview: | 7.5 |
| Leitchfield: | 84.4 |
| Fairdale: | 29.7 |
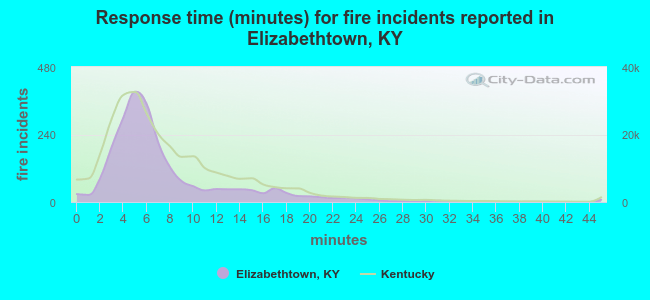 The median response time based on all reported fire incidents is 6 minutes. This is similar to the state median value.
The median response time in Elizabethtown, KY compared to nearest cities:
(Note: Based on data for all years, including only cities with at least 500 fire incidents)
| Elizabethtown: | 6 minutes |
| Vine Grove: | 9 minutes |
| Radcliff: | 5 minutes |
| Hodgenville: | 11 minutes |
| Shepherdsville: | 6 minutes |
| Bardstown: | 9 minutes |
| Brandenburg: | 9 minutes |
| Leitchfield: | 4 minutes |
| Fairdale: | 5 minutes |
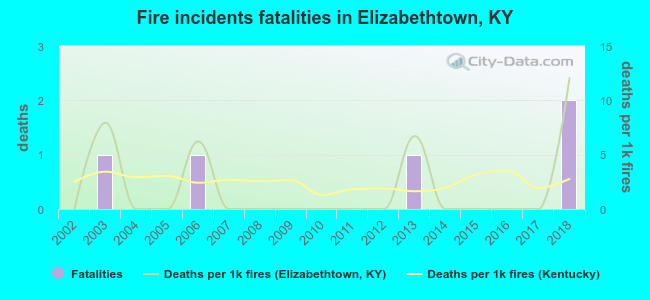 According to the reports from the years 2002 - 2018 the average number of fire-related fatalities per year is 0. The highest number of deaths - 2 took place in 2018, and the lowest - 0 in 2002. The data has a rising trend.
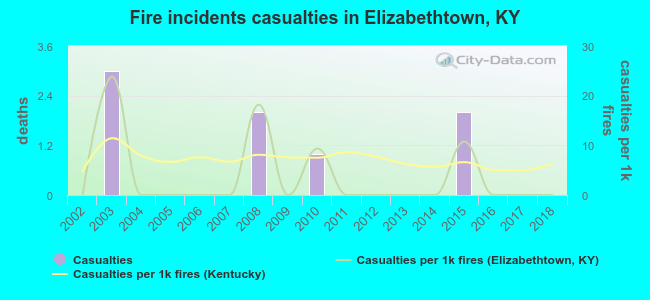 According to the reports from the years 2002 - 2018 the average number of fire-related casualties per year is 0. The highest number of injuries - 3 took place in 2003, and the lowest - 0 in 2002. The data has a constant trend.
The average number of casualties per 1,000 fire incidents is 4. This indicator was the highest - 24 in 2003, and the lowest 0 in 2002. The trend for casualties per 1,000 incidents is constant. Compared to the Kentucky value the number of injuries per 1,000 incidents is much lower.
According to the reports from the years 2002 - 2018 the average number of fire-related casualties per year is 0. The highest number of injuries - 3 took place in 2003, and the lowest - 0 in 2002. The data has a constant trend.
The average number of casualties per 1,000 fire incidents is 4. This indicator was the highest - 24 in 2003, and the lowest 0 in 2002. The trend for casualties per 1,000 incidents is constant. Compared to the Kentucky value the number of injuries per 1,000 incidents is much lower.Casualties per 1,000 incidents in Elizabethtown, KY compared to nearest cities:
(Note: Based on data for all years, including only cities with at least 500 fire incidents)
| Elizabethtown: | 3.5 |
| Vine Grove: | 1.5 |
| Radcliff: | 9.1 |
| Hodgenville: | 0.0 |
| Shepherdsville: | 6.3 |
| Bardstown: | 12.0 |
| Brandenburg: | 0.0 |
| Leitchfield: | 0.0 |
| Fairdale: | 2.4 |
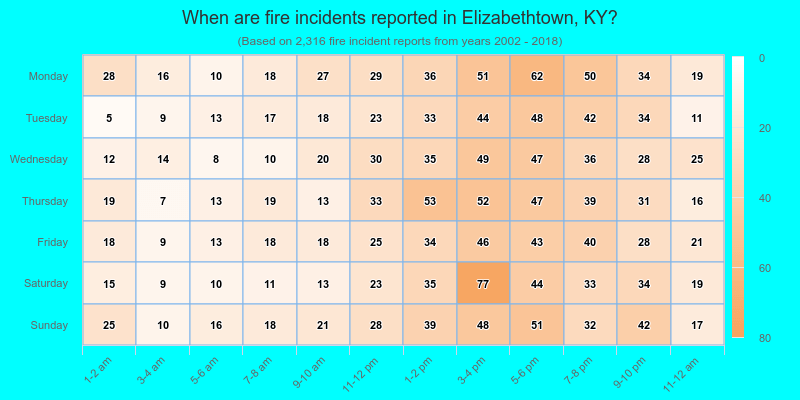
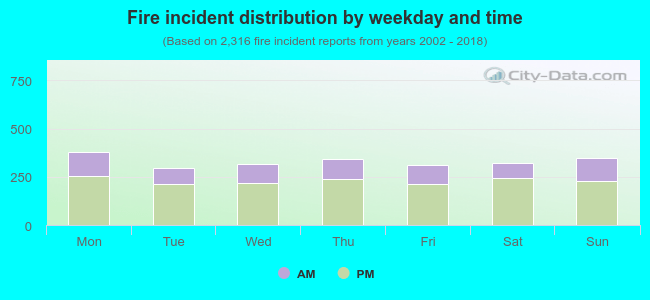 30.7% incidents where reported in the morning and 69.3% in the evening. The most fires (16.4%) took place on Monday, and the least (12.8%) on Tuesday.
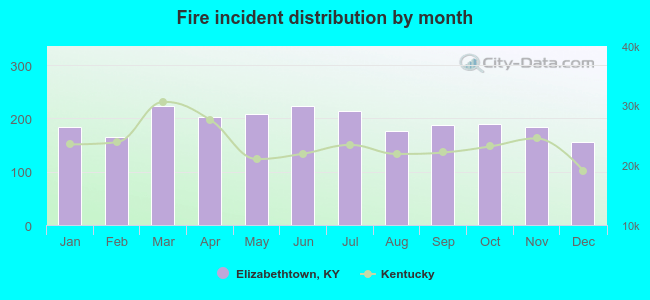 Based on the 2,316 reports from years 2002 - 2018 most fires (9.7%) took place during March, and the least (6.7%) in December.
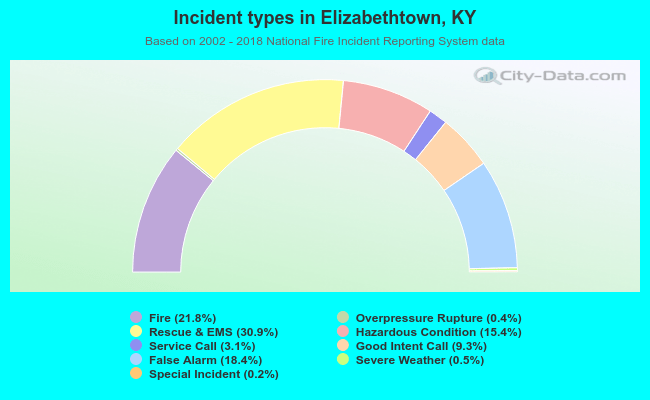 Out of all 10,617 cases reported during the years 2002 - 2018, the most belonged to the categories: Rescue & EMS (30.9%), Fire (21.8%), and False Alarm (18.4%).
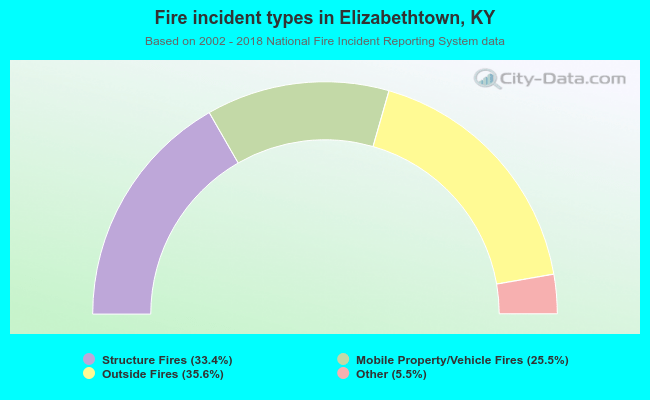 When looking into fire subcategories, the most reports belonged to: Outside Fires (35.6%), and Structure Fires (33.4%).